# Quick Start
## Content
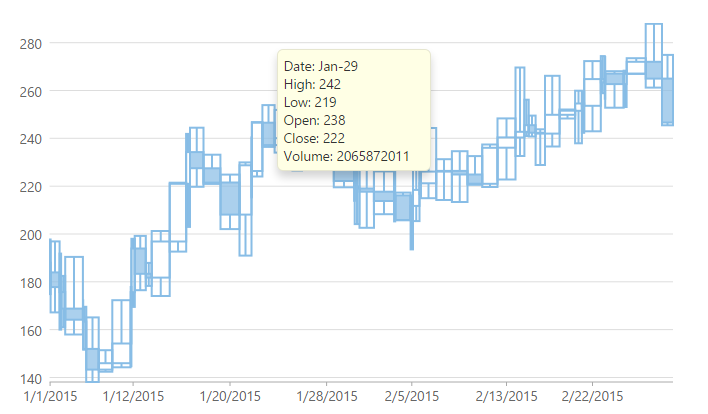
The quick start guides you through the steps of adding the **FinancialChart** control to your ASP.NET Core MVC web application, and add data to it.
Follow these steps to get started:
> type=note
> **Note**: The **ComponentOne template** for ASP.NET MVC Edition automatically registers the required resources, and adds the relevant references and packages to your application. Therefore, you need not follow the Steps 1 to 3 above if your application is created using ComponentOne template.
### License your application
* In the **Solution Explorer**, double-click the project name (for example, **MVCFinancialChart**) and expand node **Properties.**
* Double-click the **licenses.licx** file to open it.2. In the **licenses.licx** file, add the following:
```LICENSES.LICX
C1.Web.Mvc.LicenseDetector, C1.Web.Mvc
C1.Web.Mvc.Finance.LicenseDetector, C1.Web.Mvc.Finance
```
For more information on how to add license to your application, refer to [Licensing](/componentone/docs/mvc/online-mvc-core/GettingStarted/Licensing).
### Add the relevant references to your application
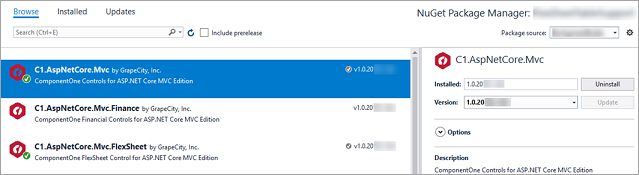
1. Add the ASP.NET MVC Edition references to the project. In the **Solution Explorer**, right click **References** and select **Manage NuGet Packages**. In **NuGet Package Manager**, select **https://api.nuget.org/v3/index.json** as the Package source. Search for **C1.AspNetCore.Mvc** package, and click **Install**.
> type=note
> **Note**: `"C1.AspNetCore.Mvc"` gets added under the "dependencies" within project.json file of your project once you restore the packages.
2. To work with **Financial Chart** control in your application, add **C1.AspNetCore.Mvc.Finance** package. Once you restore the packages, "C1.AspNetCore.Mvc.Finance" gets added under the "dependencies" in project.json file.
### Configure the application to use FinancialChart
1. From the **Solution Explorer**, expand the folder **Views** and double click the \_ViewImports.cshtml file to open it.
2. Add the following references to work with Financial Chart control in your ASP.NET Core application,
```csharp
@addTagHelper *, C1.AspNetCore.Mvc
@addTagHelper *, C1.AspNetCore.Mvc.Finance
```
### Register Resources
Complete the following steps to register the required resources for using ASP.NET MVC FinancialChart control:
1. From the **Solution Explorer**, open the folders **Views | Shared**.
2. Double click `_Layout.cshtml` to open it.
3. Add the following code between the `` tags.
```razor
```
For more information on how to register resources for **FinancialChart**, refer to [Registering Resources](RegisteringResources.html).
### Create a Datasource for FinancialChart
2. Add a new class to the folder **Models** (for example: `FinanceData.cs`). See [Adding controls](addingcontrols.html) to know how to add a new model.
3. Add the following code to the new model to define the classes that serve as a datasource for the FinancialChart control.
```csharp
using System;
using System.Collections.Generic;
using System.Linq;
using System.Text;
using System.Threading.Tasks;
namespace MVCFinancialChart.Models
{
public class FinanceData
{
public DateTime X { get; set; }
public double High { get; set; }
public double Low { get; set; }
public double Open { get; set; }
public double Close { get; set; }
public double Volume { get; set; }
}
}
```
### Add a FinancialChart control
Complete the following steps to initialize a FinancialChart control.
**Add a new Controller**
1. In the **Solution Explorer**, right click the folder **Controllers.**
2. From the context menu, select **Add | Controller**. The **Add Scaffold** dialog appears.
3. Complete the following steps in the **Add Scaffold** dialog:
1. Select **Empty MVC Controller** template.
2. Set name of the controller (for example: `Default1Controller`).
3. Click **Add**.
4. Include the MVC references as shown below.
```csharp
using C1.Web.Mvc;
using C1.Web.Mvc.Serializition;
```
5. Replace the method `Index()` with the following method.
```csharp
public ActionResult Index()
{
var model = GenerateFinanceData();
return View(model);
}
private List GenerateFinanceData(int count = 60)
{
List financeDatas = new List() { };
DateTime startTime = new DateTime(2015, 1, 1);
var rand = new Random();
double high, low, open, close, volume;
for (int i = 0; i < count; i++)
{
DateTime dt = startTime.AddDays(i);
if (i > 0)
open = financeDatas[i - 1].Close;
else
open = 188;
high = open + rand.NextDouble() * 30;
low = open - rand.NextDouble() * 20;
close = low + rand.NextDouble() * (high - low);
volume = rand.Next();
financeDatas.Add(new FinanceData { X = dt, High = high, Low = low, Open = open, Close = close, Volume = volume });
}
return financeDatas;
}
```
**Add a View for the Controller**
1. Within the Controller, which was added in the above step, place the cursor inside the method `Index()`.
2. Right click and select **Add View**. The **Add View** dialog appears.
3. In the **Add View** dialog, verify that the view name is **Index** and View engine is **Razor (CSHTML).**
4. Click **Add**. A view is added for the controller.
5. Instantiate a FinancialChart control in the view QuickStart as shown below.
```html
@using C1.Web.Mvc.Chart;
```
### Build and Run the Project
1. Click **Build | Build Solution** to build the project.
2. Press **F5** to run the project.
> type=note
> Append the folder name and view name to the generated URL (for example: http://localhost:1234/**QuickStart/Index**) in the address bar of the browser to see the view.