# Multiple Pie Chart
There might be a scenario where you want to visualize and compare data of a category across different groups. This can be achieved plotting multiple pie charts together.
## Content
There might be a scenario where you want to visualize and compare data of a category across different groups. This can be achieved plotting multiple pie charts together. In the following example, we are comparing the downloads and sales of a product in different countries using multiple pie charts.
FlexPie allows user to create multiple pie charts, based on the same data source, by simply specifying several comma-separated strings of field names in **Binding** property of the FlexPie class.
The following image shows four pie charts displaying sales data of respective mobile companies for four quarters.
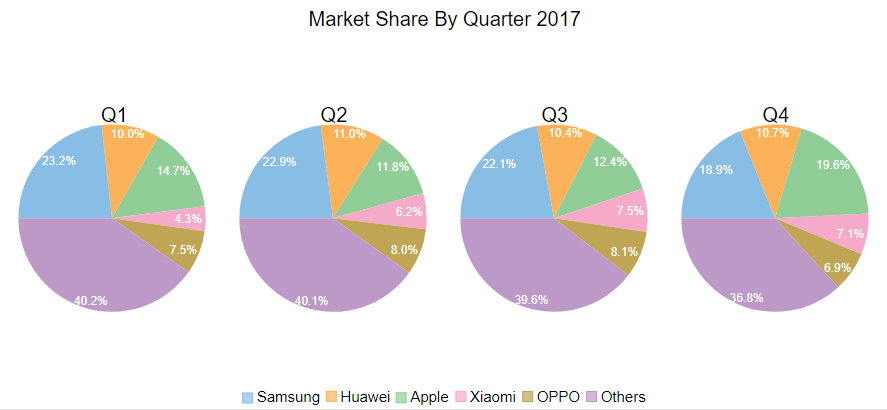
The following code demonstrates how to add multiple pie charts using the same data source.
```razor
@using Localization
@using C1.Chart;
@using C1.Blazor.Chart;
@code {
public class DataSource
{
public class SalesData
{
public string Brand { get; set; }
public double Q1 { get; set; }
public double Q2 { get; set; }
public double Q3 { get; set; }
public double Q4 { get; set; }
}
public static List GetData()
{
return new List()
{
new SalesData()
{
Brand = "Samsung",
Q1 = 23.2,
Q2 = 22.9,
Q3 = 22.1,
Q4 = 18.9
},
new SalesData()
{
Brand = "Huawei",
Q1 = 10.0,
Q2 = 11.0,
Q3 = 10.4,
Q4 = 10.7
},
new SalesData()
{
Brand = "Apple",
Q1 = 14.7,
Q2 = 11.8,
Q3 = 12.4,
Q4 = 19.6
},
new SalesData()
{
Brand= "Xiaomi",
Q1 = 4.3,
Q2 = 6.2,
Q3 = 7.5,
Q4 = 7.1
},
new SalesData()
{
Brand = "OPPO",
Q1 = 7.5,
Q2 = 8.0,
Q3 = 8.1,
Q4 = 6.9
},
new SalesData()
{
Brand = "Others",
Q1 = 40.2,
Q2 = 40.1,
Q3 = 39.6,
Q4 = 36.8
}
};
}
}
```