# Quick Start

This quick start guides you through the steps of adding the FlexChart control in your Blazor application, adding data to it and displaying the data in the control.

## Content


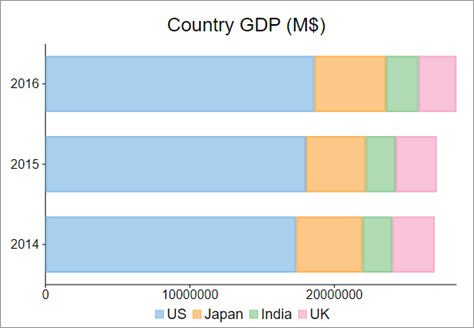
This quick start guides you through the steps of adding the FlexChart control in your Blazor application, adding data to it and displaying the data in the control. In this example, we create a data source for FlexChart by creating list of countries and their GDP values for respective years and bind the list to the FlexChart control to display the data using Bar Chart in the control.
![FlexChart](https://cdn.mescius.io/document-site-files/images/f5b600ba-f1a7-4f89-a20c-aa6c0c35880d/images/barquickstart.png)

## Create a Blazor App

1.  In Visual Studio, select **Create a new project** from the **Get started** pane.
2.  In the **Create a new project** window, select **Blazor WebAssembly App**, and click **Next**. Alternatively, you can also create a Blazor Server App. 
	> type=note
	> **Note**: **Blazor Server App** or server-side app can be created using the Blazor Server App template. For more details, see [Blazor Server](/componentone/docs/blazor/online-blazor/blazortypes/blazorserver) topic under Blazor Project Types.
3.  In the **Configure your new project** dialog, provide name of the project you want to create in the **Project name** field and location for the project in the **Location** field. Click **Next**.
4.  In the **Additional information** dialog, select the target framework from the **Framework** dropdown, if required and click **Create**. By default, the selected framework is **.NET 8.0**.<br />A new client-side Blazor app is created.

## Configure References

1.  In the **Solution Explorer**, right click **Dependencies** and select **Manage NuGet Packages**.
2.  In **NuGet Package Manager**, select **nuget.org** as the **Package source**.
3.  Search for **C1.Blazor.Chart** package and click **Install**.
4.  Navigate to the **wwwroot**, open **index.html** file.
5.  Register the client resources by adding the following lines of code to the **\<head>** tag.<br />
    
    ```EXAMPLE
    <link rel="stylesheet" href="/_content/C1.Blazor.Core/styles.css" />
    <link rel="stylesheet" href="/_content/C1.Blazor.Chart/styles.css" />
    ```
    
6.  Add the following code to the **\<body>** tag.
    
    ```html
    <script src="/_content/C1.Blazor.Core/scripts.js"></script>
    <script src="/_content/C1.Blazor.Chart/scripts.js"></script>
    ```
    
7.  Right click on **Pages** folder, click **Add |** **Razor Component** to add a new Razor page and then provide a name, say _FlexChartBoxQuickStart._

## Configure the Data Source

In the code, add a DataSource class to create a list of data for the FlexChart control.

```razor
@code {
    public class GdpDataSource
    {
        public static List<object> GetCountryGdp()
        {
            return new List<object> {
                new 
                {
                    year = "2014",
                    US = 17348075,
                    Japan = 4602367,
                    UK = 2950039,
                    India = 2051228
                },
                new
                {
                    year = "2015",
                    US = 18036650,
                    Japan = 4124211,
                    UK = 2858482,
                    India = 2073002
                },
                new 
                {
                    year = "2016",
                    US = 18624450,
                    Japan = 4936540,
                    UK = 2629190,
                    India = 2263790
                }
            };
        }
    }
 }
```

## Bind FlexChart to Data

To bind FlexChart to data, set the [ItemsSource](/componentone/api/blazor/online-blazor/dotnet-api/C1.Blazor.Chart/C1.Blazor.Chart.FlexChart.ItemsSource.html) property of [FlexChart](/componentone/api/blazor/online-blazor/dotnet-api/C1.Blazor.Chart/C1.Blazor.Chart.FlexChart.html) class of which accepts the collection of items for the FlexChart control to create a Bar chart.

The [Binding](/componentone/api/blazor/online-blazor/dotnet-api/C1.Blazor.Chart/C1.Blazor.Chart.FlexChart.Binding.html)**/**[BindingX](/componentone/api/blazor/online-blazor/dotnet-api/C1.Blazor.Chart/C1.Blazor.Chart.FlexChart.BindingX.html) properties should contain the names of properties of items from data source collection (FlexChart.ItemsSource property).

You need to set **Binding** property to specify a name of numeric property that should be plotted along y-axis and **BindingX** property to specify a name of property that should be plotted along x-axis. The property set by BindingX can be numeric as well as string (for category x-axis).

Also, the **ItemsSource/Binding/BindingX** can be also specified on a **series** level. If any of these properties isn't set, the series uses the corresponding properties of parent chart.

```razor
@using C1.Chart;
@using C1.Blazor.Chart;
<FlexChart Class="chart" ChartType="ChartType.Bar" Stacking="Stacking.Stacked" 
           HeaderContent="Country GDP (M$)" HeaderStyle="font-size:24px"
           LegendPosition="Position.Bottom" LegendStyle="font-size:18px"
           BindingX="year" ItemsSource="@GdpDataSource.GetCountryGdp()">
    <SeriesCollection>
        <Series Name="US" Binding="US" />
        <Series Name="Japan" Binding="Japan" />
        <Series Name="India" Binding="India" />
        <Series Name="UK" Binding="UK" />
    </SeriesCollection>
    <AxisCollection>
        <Axis AxisType="AxisType.X" Position="Position.Bottom" />
        <Axis AxisType="AxisType.Y" Position="Position.Left"/>
    </AxisCollection>
</FlexChart>
```

## Build and Run the Project

1.  Click **Build | Build Solution** to build the project.
2.  Press **F5** to run the project.