# Range Selector
Select the desired range precisely and effectively with range selector in Blazor FlexChart. Learn more about range selection in Blazor documentation.
## Content
Range selector is a modern approach of scrolling the charts with huge data. In this case, instead of usual scroll bars, another broad view chart is displayed so that end-user can select the desired range more precisely and effectively. Just like axis scroll bars, range selector also acts as a tool for end-user for analyzing the selected range of data in detail. Analysis of stock charts is one of the good example where a range selector is used.
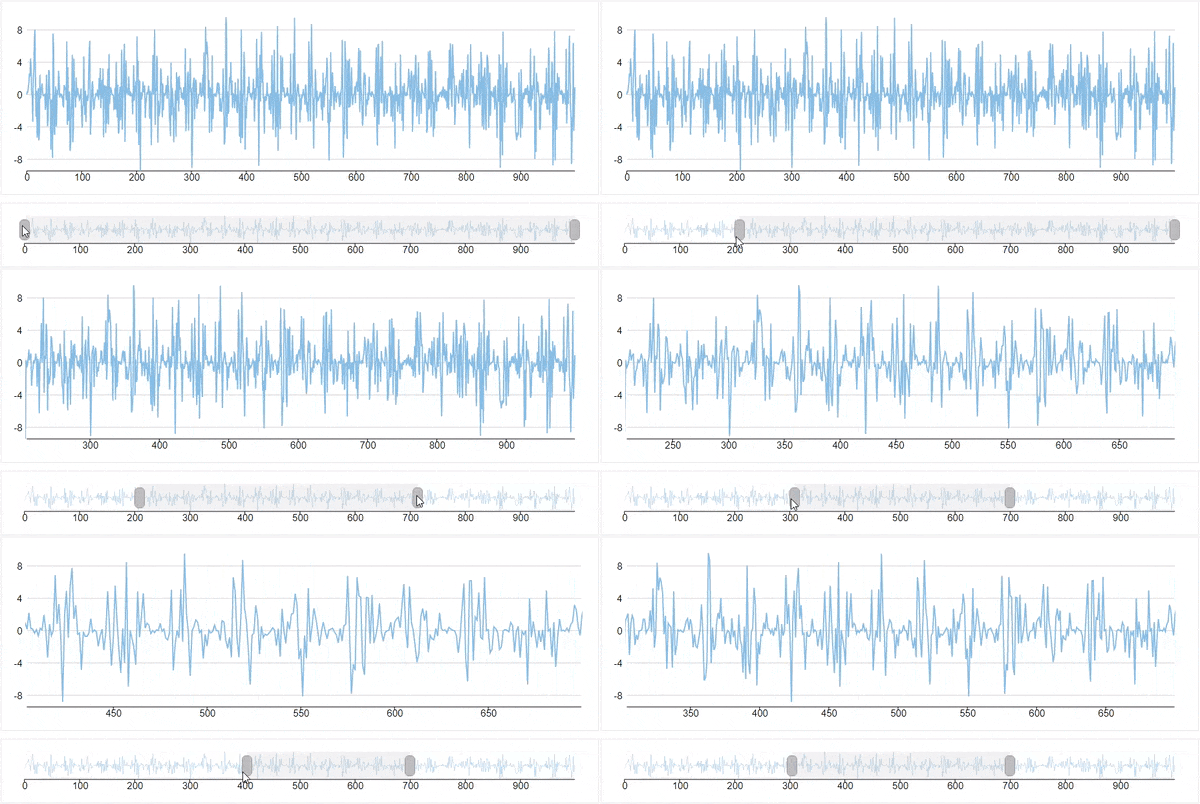
FlexChart provides range selector that lets you select a range of numeric data with lower value thumb and upper value thumb. These thumbs define the start and end values of the range. On dragging the thumb towards left (or down) on the range bar, you reduce its value, and dragging it towards the right (or up) increases the value on the range bar.
FlexChart provides [RangeSelector](/componentone/api/blazor/online-blazor/dotnet-api/C1.Blazor.Chart/C1.Blazor.Chart.Interaction.RangeSelector.html) class which represents a chart's range selector. To add a range selector, you need to create an instance of the **RangeSelector** class and assign it to [RangeSelector](/componentone/api/blazor/online-blazor/dotnet-api/C1.Blazor.Chart/C1.Blazor.Chart.FlexChart.RangeSelector.html) property of the [FlexChart](/componentone/api/blazor/online-blazor/dotnet-api/C1.Blazor.Chart/C1.Blazor.Chart.FlexChart.html) class. In the following example,we demonstrate how to display a range selector on the FlexChart.
```razor
@using C1.Chart;
@using C1.Blazor.Chart;
@using C1.Blazor.Chart.Interaction;
@code {
C1.Blazor.Chart.Interaction.RangeSelector rs = new C1.Blazor.Chart.Interaction.RangeSelector();
FlexChart chart;
FlexChart chartOverview;
List Data { get; set; }
protected override void OnInitialized()
{
Data = DataSource.GetData();
rs.ValueChanged += (s, e) =>
{
chart.BeginUpdate();
var amin = chartOverview.AxisX.ActualMin;
var amax = chartOverview.AxisX.ActualMax;
chart.AxisX.Min = amin + rs.LowerValue * (amax - amin);
chart.AxisX.Max = amin + rs.UpperValue * (amax - amin);
chart.EndUpdate();
};
}
public class DataSource
{
private static Random rnd = new Random();
public class Quote
{
public int Day { get; set; }
public double Value { get; set; }
}
public static List GetData()
{
var data = new List();
for (int i = 0; i < 1000; i++)
{
var r = rnd.NextDouble();
var y = (10 * r * Math.Sin(0.1 * i) * Math.Sin(0.6 * rnd.NextDouble() * i));
var country = new Quote
{
Day = i,
Value = y
};
data.Add(country);
}
return data;
}
}
}
```