# Custom Chart
This topic demonstrates how to use a custom report item - Radar chart in a report with ActiveReports.
## Content
This sample illustrates creating custom report item - Radar Chart. The **ICustomReportItem** interface is used to implement custom control, which is radar chart. The designer inherited from **CustomReportItemDesigner** class allows the chart to be available on the designer. The sample uses shared data source Nwind.rdsx.
### Sample Location
**Visual Basic.NET**
[https://github.com/activereports/Samples20/tree/main/Advanced/PageAndRDLX/CustomChart/VB.NET](https://github.com/activereports/Samples20/tree/main/Advanced/PageAndRDLX/CustomChart/VB.NET)
**C#**
[https://github.com/activereports/Samples20/tree/main/Advanced/PageAndRDLX/CustomChart/C#](https://github.com/activereports/Samples20/tree/main/Advanced/PageAndRDLX/CustomChart/C%23)
### Details
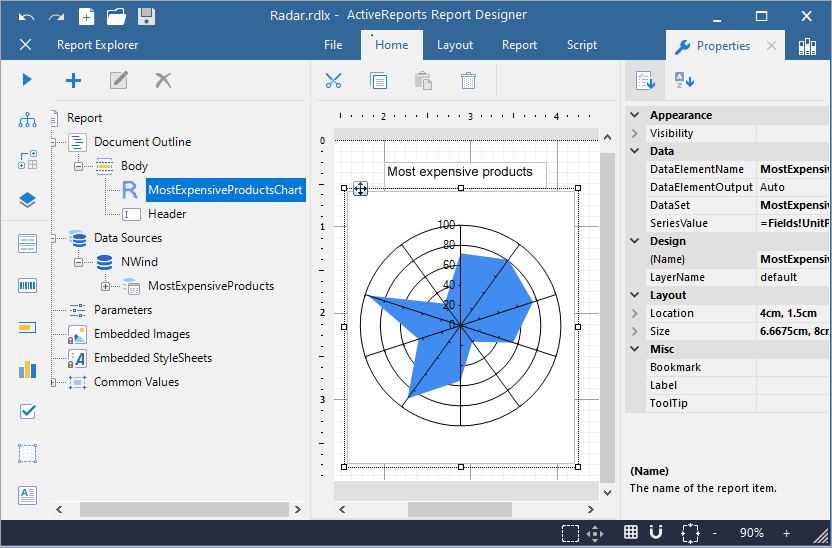
When you run this sample, an RDLX report 'Radar.rdlx' with Radar chart is displayed on the designer. Go to the Preview tab of the designer to view the report with data pulled from Nwind.rdsx.
The sample consists of following projects:
* RadarChart: It implements **ICustomReportItem** interface to render Radar chart and **IDataRegion** for data binding. The **IImageRenderer** interface renders data to image; this renderer accesses custom data grouping (note that series property name should be same as that defined in designer) and reads values for the chart series.
* RadarDesigner: The designer is inherited from **CustomReportItemDesigner** class. To render one series, one data grouping is added in the **Initialize** method. Custom properties called DataSetName and SeriesValue are added which can be changed in the designer, see classes **DataSetNamesConverter** and **RadarValuesConverter**. For design-time rendering, **RadarControlGlyph** class implements overriding **ControlGlyph** property of the designer and rendering stub data. In this glyph, the **MovableBehavior** method implements moving and resizing of the chart control.
* TestDesignerPro: This is the default start up project. On running this project, an RDLX report with Radar chart is displayed on the designer. You can change the chart properties from the Properties pane. You can also drag and drop and use the Radar Chart control available on the toolbox.
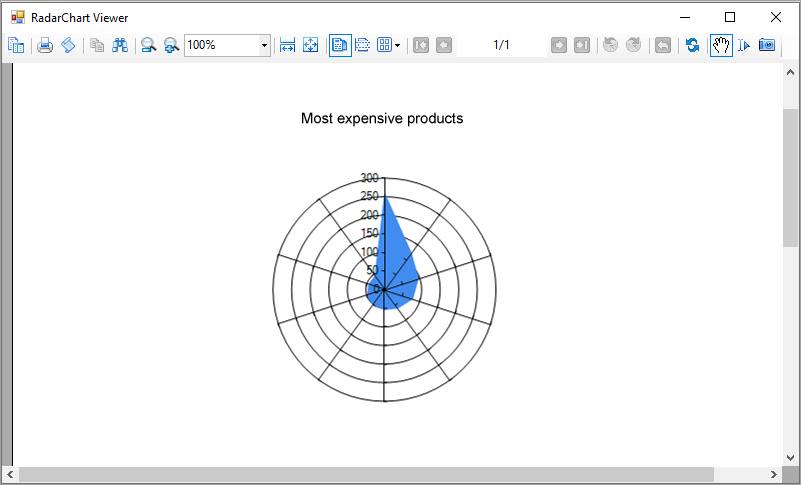
* TestViewer: On running this project, Radar chart is rendered on Windows Forms Viewer.
The custom report item (**RadarChart**) and its designer (**RadarDesigner**) are defined in **ActiveReports.config** file placed in test application projects.