# Configuring Table
ActiveReports provides a Visual Studio integrated report designer, rich controls to create and modify reports, and interactive report viewers to preview the reports.
## Content
### General
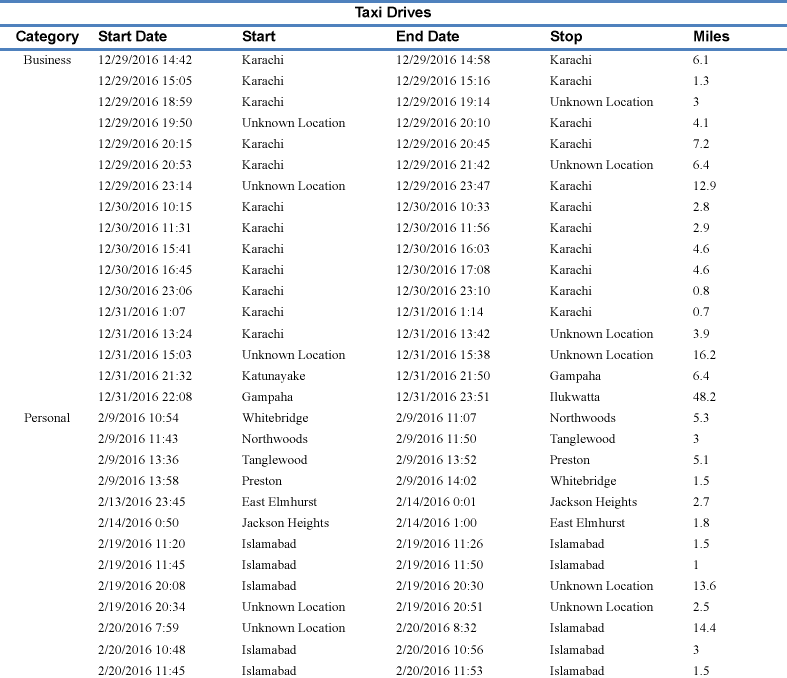
A [Table](/activereportsnet/docs/v19.2/report-authors/report-controls/report-controls-page-rdl-report/table) is a data display control that visualizes your data in a structured, multicolumn, multirow format. Below is an example of how a table that displays Taxi Drives data appears in the report output:

The report wizard guides you through the process of configuring a table with a series of intuitive steps, as described below.
### Choosing Table Query and Field
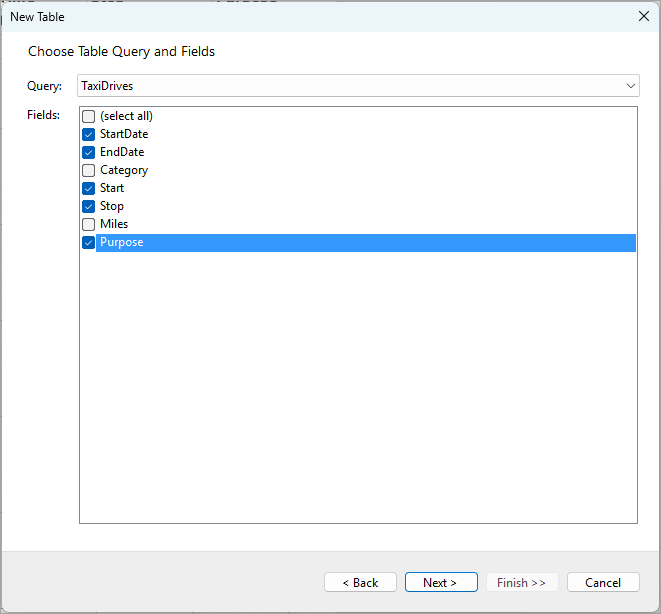
In the **Query** drop-down, you can select one of the report's available data queries. For detailed information on setting up queries, see the [Configuring Data Queries in Report Wizard](/activereportsnet/docs/v19.2/report-authors/using-report-wizard/configuring-data-queries) and Configuring Data Set Properties documentation pages.
The **Fields** list displays all the fields retrieved by the selected query. To display all these fields in the table, click the **(select all)** checkbox. Alternatively, you can select only a subset of fields that should be displayed in the table, as shown in the screenshot above. Click **Next >** to proceed to the next step.
### Configuring Table Groupings
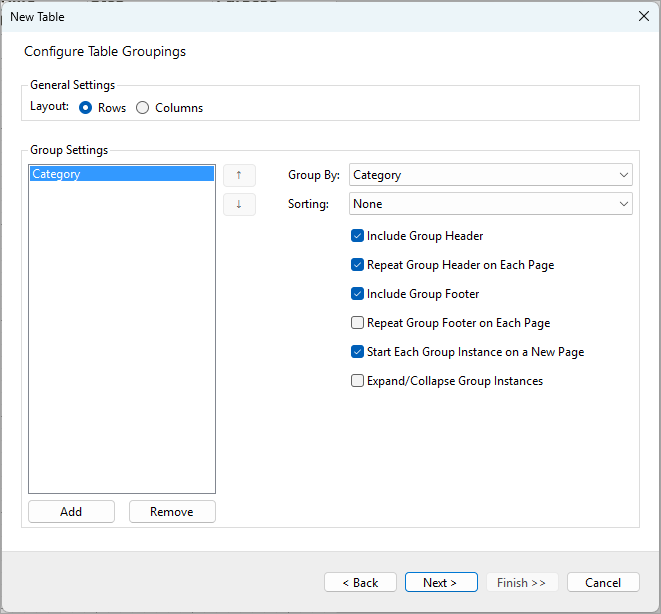
The **Configure Table Groupings** step allows you to organize your data into groups, making it easier to analyze and display. Groupings are especially useful when you want to categorize your data by specific fields, such as taxi drive category, as shown in the screenshot.
### General Settings
In the Layout section, you can choose how the groups are organized:
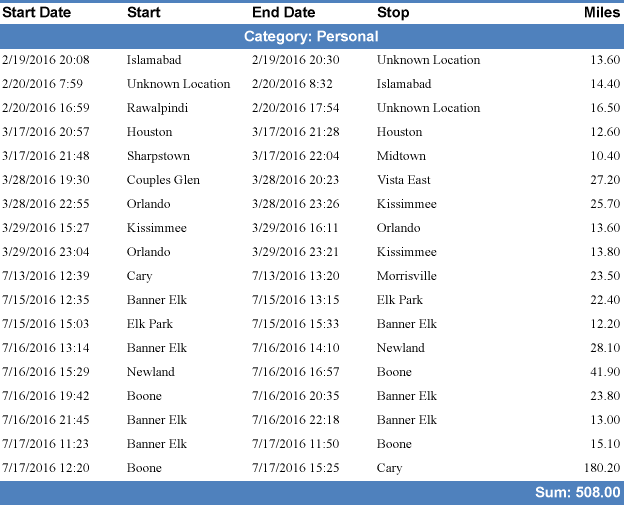
* **Rows**: This option generates rows for group headers and footers of each group instance. It allows to conditionally include or exclude group header and footer and repeat them on each page. The following screenshot shows a table with taxi drives data grouped by the drive category, displaying the category name in the group header and the summary values in the group footer:
* **Columns**: This option generates a column group header for each group instance. With this type of the layout, the column acts as a group header, but the group footer is still a row that could display the summary values.
### Group Settings
This section provides settings for configuring the groupings.
* **Group By**: Select the field by which you want to group your data. In the example, the data is grouped by the **Category** field.
* **Sorting**: Choose how the group instances should be sorted. The default option is **Ascending**, but you can also choose **Descending** depending on how you want to display the groupings.
* **Include Group Header**: Checking this option will include a header for each group instance, indicating which data belongs to which group.
* **Repeat Group Header on Each Page**: If your group instances span multiple pages, enabling this will repeat the group header at the top of each new page. This is helpful for reports where the group context is important.
* **Include Group Footer**: If enabled, this will add a footer at the end of each group instance, which is useful for totals or summaries.
* **Repeat Group Footer on Each Page**: Similar to the group header, this will repeat the footer for the group instance on every page where the instance is displayed.
* **Start Each Group Instance on a New Page**: This ensures that each new group instance begins on a new page, making the report cleaner and more organized.
* **Expand/Collapse Group Instances**: If checked, the report viewer will display a toggle to expand or collapse each group instance, giving report readers more control over how much data is visible at once.
Once you have configured your group settings, click **Next >** to proceed to the next step.
### Configuring Table Columns
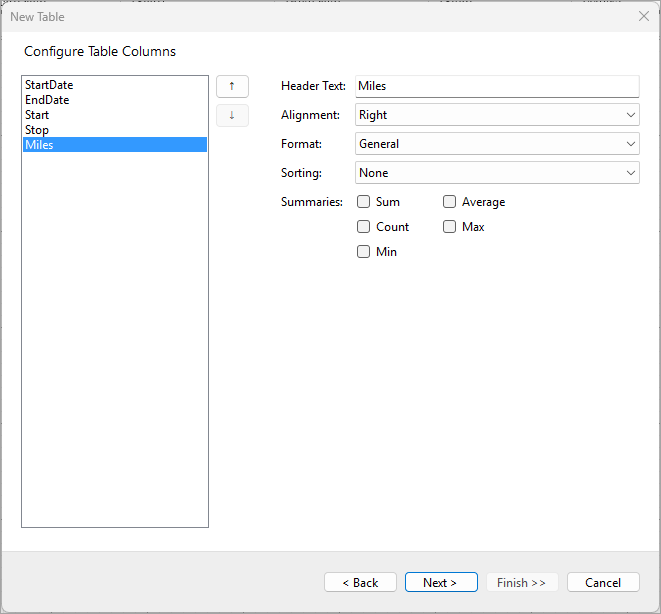
The **Configure Table Columns** configuration step allows you to customize the columns that will be displayed in your table. The list on the left side shows the fields that were selected on the initial **Choose Table Query and Fields** screen. However, fields that were selected for groupings in the previous step will be excluded from this list.
Each field in this list will be represented as a column in the table. You can modify various properties for each column, as explained below.
### Rearranging Columns
You can change the order in which the columns appear in the table by selecting a field and using the **Up** (↑) and **Down** (↓) buttons on the right side of the list. This allows you to rearrange the order of columns according to your reporting needs.
### Modifying Column Properties
When a field is selected, its properties can be adjusted in the section on the right.
* **Header Text**: This is the text that will be displayed at the top of the column. You can modify it to make it more descriptive or suitable for the report. In the example, the **StartDate** field has its header text as "Start Date."
* **Alignment**: Use the **Alignment** dropdown to control how the content in this column will be aligned within the table. Options include:
* **Left**: Align the content to the left.
* **Center**: Center the content.
* **Right**: Align the content to the right.
* **Format**: The **Format** option lets you choose how the data in the column will be displayed. This is especially useful for formatting dates, numbers, or currency.
* **Sorting**: You can choose to apply sorting to the column’s data. Available options are:
* **None**: No sorting will be applied.
* **Ascending**: Data will be sorted in ascending order (e.g., A-Z or 1-10).
* **Descending**: Data will be sorted in descending order (e.g., Z-A or 10-1).
* **Summaries**: You can apply summary functions to the data in this column. Available summary types include:
* **Sum**: Adds up all the values.
* **Count**: Counts the number of records.
* **Min**: Finds the minimum value.
* **Max**: Finds the maximum value.
* **Average**: Calculates the average value.
Summary values will be displayed in the group footer(s), if they were configured, and also in the table footer.
Once you've made the necessary modifications, click **Next >** to proceed to the next configuration step.
### Configuring Table Colors
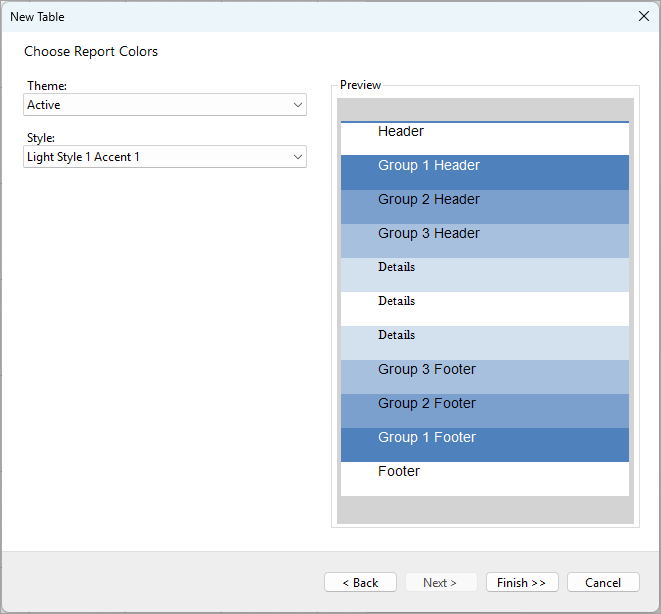
In the final step of the Table Wizard, you can apply a color theme and style to your table to make it visually appealing and ensure consistency in the design. The preview pane on the right allows you to see how your table will look with the selected theme and style before finalizing the configuration.
### Theme
The **Theme** dropdown allows you to select from a variety of pre-defined themes that determine the base color palette for the table. For instance, the screenshot shows the **Active** theme selected, which applies a specific set of colors to different table elements, such as headers, footers, and data rows.
### Style
The **Style** dropdown provides additional customization within the selected theme by offering various styles to apply. These styles can subtly change how colors are used in the table. In the screenshot, the **Light Style 1 Accent 1** is selected, which applies different shades of blue to the headers and footers, giving the table a clean and professional appearance.
### Preview
On the right side, the **Preview** section shows how your selections will look when applied to the table. The preview displays how different table elements—like the header, group headers, group footers, details, and the table footer—will be styled. Each group header and footer is visually distinct, using alternating colors to improve readability.
Once you’ve chosen the desired theme and style, click **Finish >>** to apply the settings and generate the table in your report.
## See Also
[Table](/activereportsnet/docs/v19.2/report-authors/report-controls/report-controls-page-rdl-report/table)