# Quick Start
This tutorial explains how to create an RDLX report to represent sales data using tables and charts.
## Content
Let us create a report to represent sales data using tables and charts.
### Create Report in Visual Studio Integrated Designer
1. [Install ActiveReports](/activereportsnet/docs/v19.2/devops/install-activereports).
2. In **Microsoft Visual Studio 2022** (version 17.0 or above), select **ActiveReports 19 ASP.NET Core** template and click **Next**.
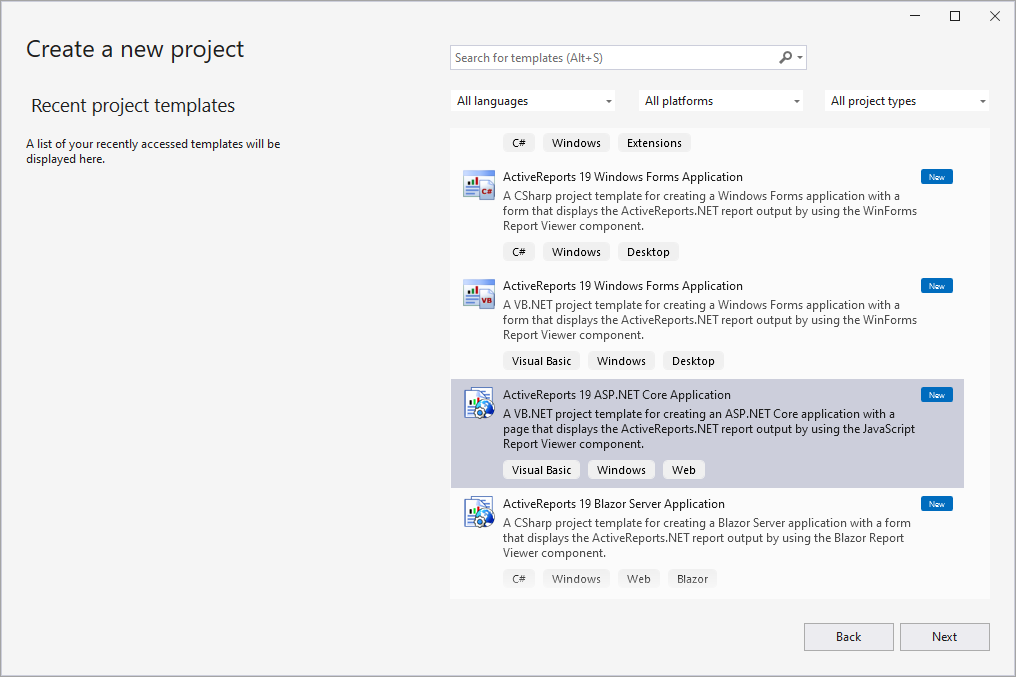
For complete list of built-in templates, see the [Project Templates](/activereportsnet/docs/v19.2/devops/install-activereports).
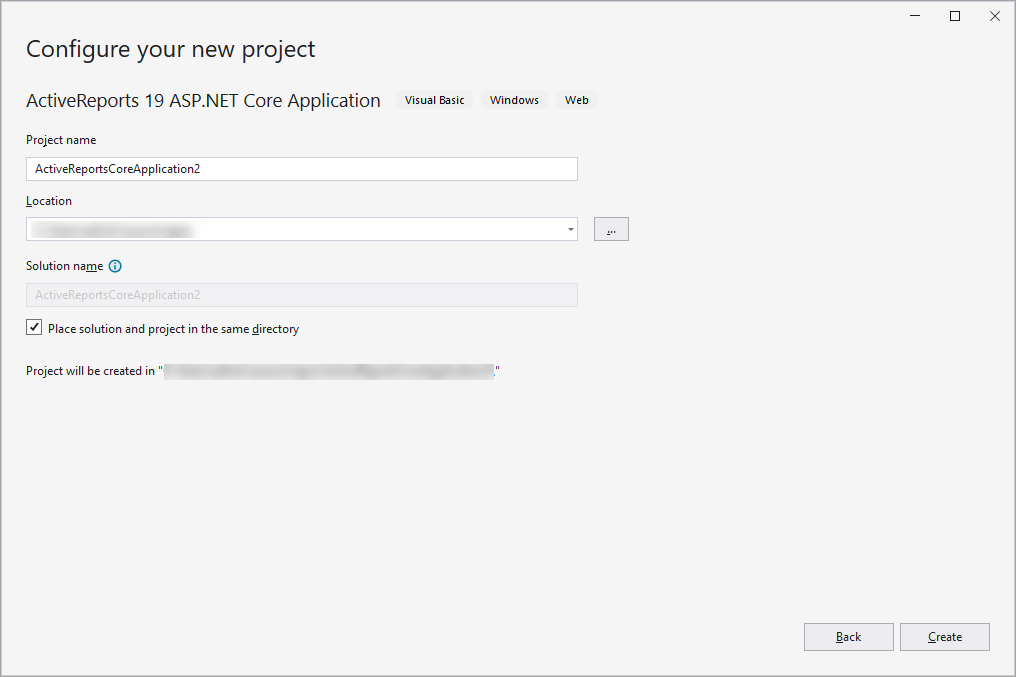
3. Type a name for your project and click **Create**.
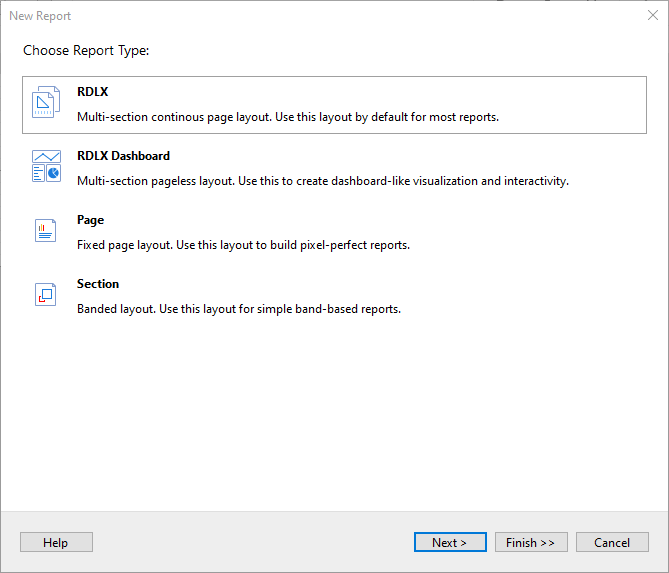
4. In the **New Report** wizard, choose the Report Type as **RDLX** and click **Next**.
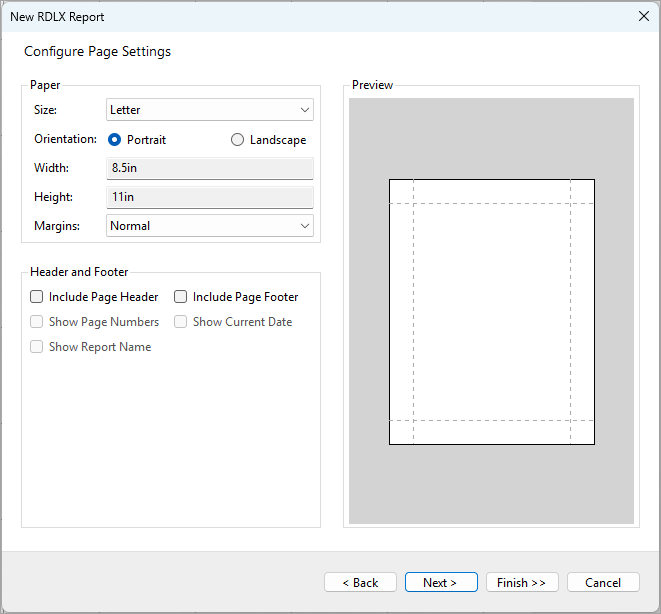
5. In the **Configure Page Settings** screen that appears, adjust the report page settings and click **Next >**.
### Bind Report to Data
1. On the **Choose Data Source Type** screen of the wizard, select **CSV** and click **Next**.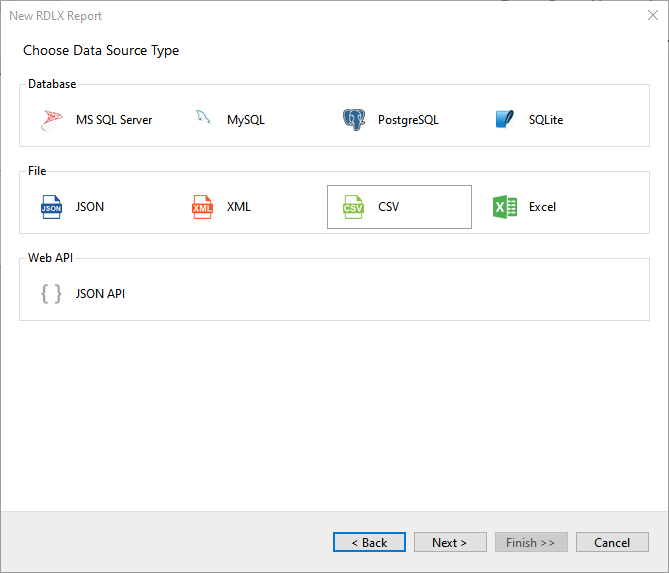
2. On the **Configure CSV Connection** screen, specify the **File Path** by clicking the **Browse** button and navigating to the desired folder on your system. Let us bind data to the [AcmeStore.csv](https://cdn.mescius.io/document-site-files/images/b298aea2-8cb8-4a0f-be88-4f54aa263ebd/file/acmestore.csv) file. See [CSV](/activereportsnet/docs/v19.2/report-authors/data-binding/data-binding-page-rdl-reports/connect-to-a-data-source/csv) topic for more information.
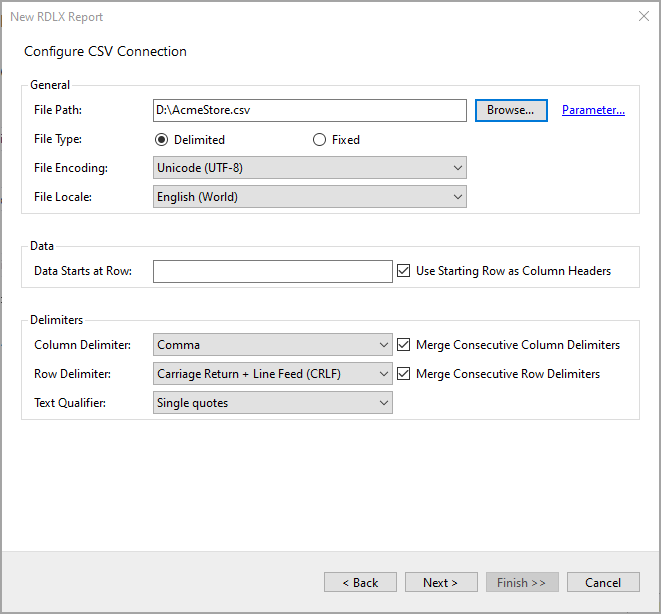
3. Click **Next** to proceed to the step of configuring CSV data fields.
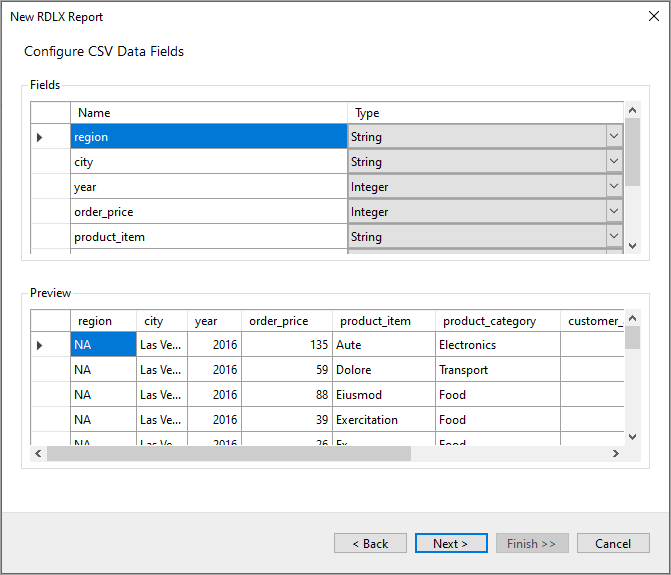
4. Click **Next** to proceed to the next step of selecting a report control.
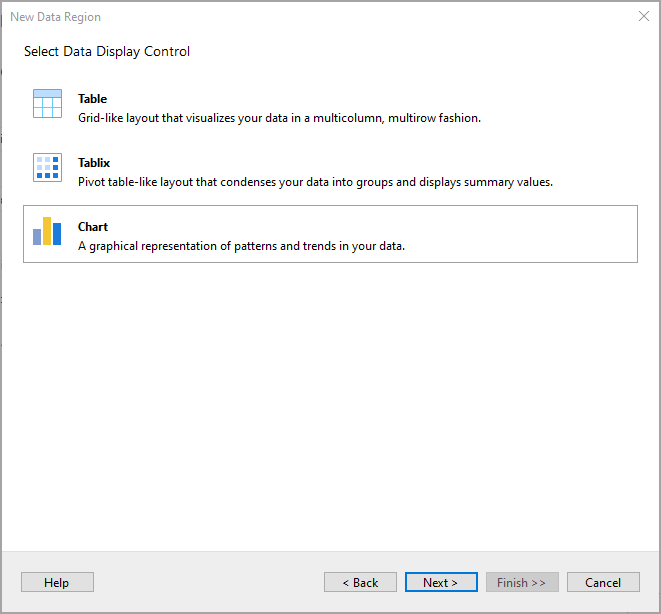
5. Select **Chart** and click **Next >**.
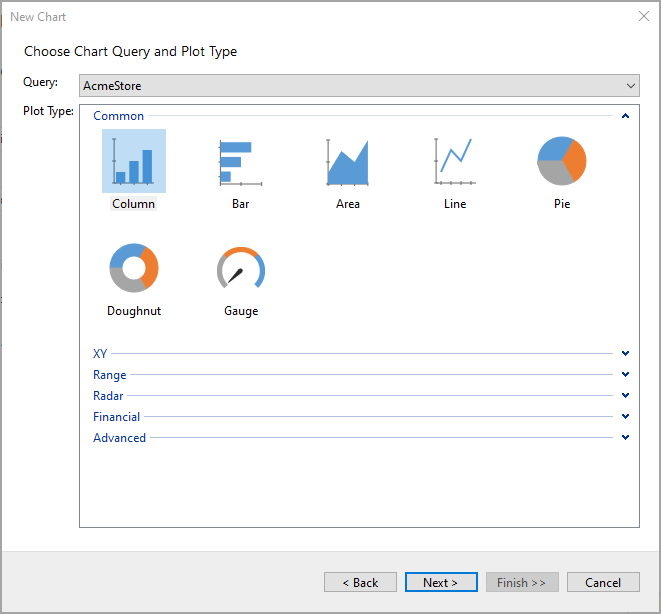
6. Let's design a chart that shows the total sales in different cities. On the **Choose Chart Query and Plot Type** screen, select **Column** in the **Plot Type** area and click **Next >**.
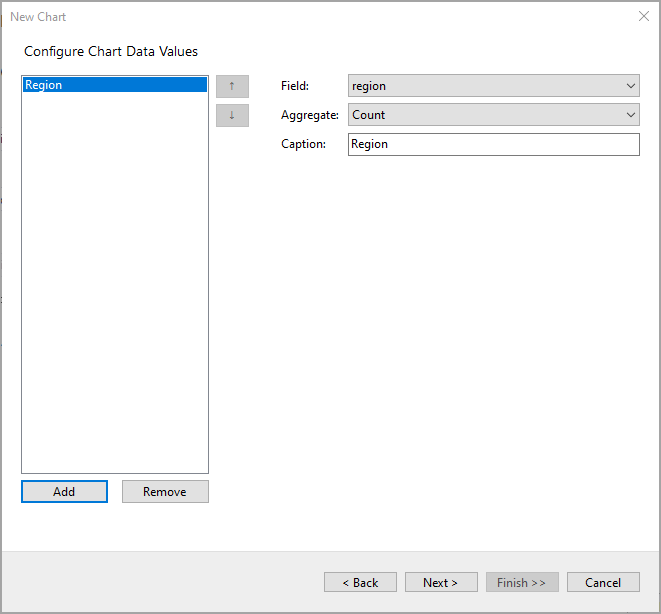
7. Configure chart data in the **Configure Chart Data Values** screen and click **Next >**. See [Create Clustered Column Chart](/activereportsnet/docs/v19.2/report-authors/report-controls/report-controls-page-rdl-report/chart-page-rdl/plots/column-bar-dvcharts/create-clustered-column-chart) tutorial to visualize the data in a stacked column chart.
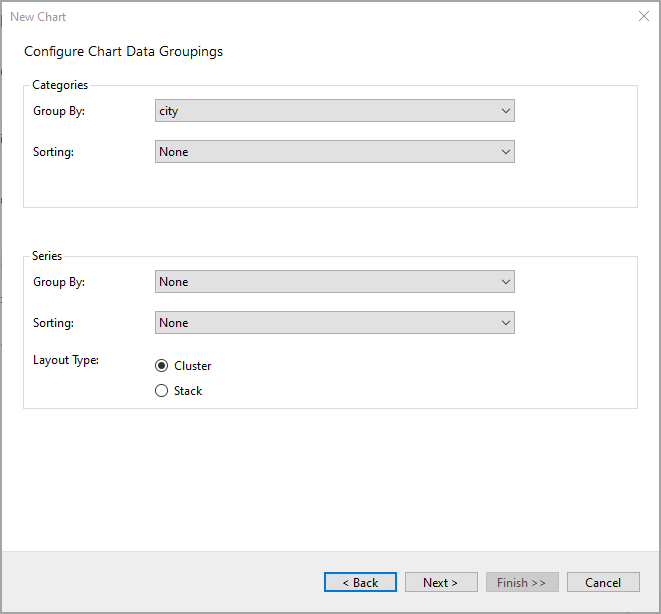
8. At the next step, you can configure chart groupings.
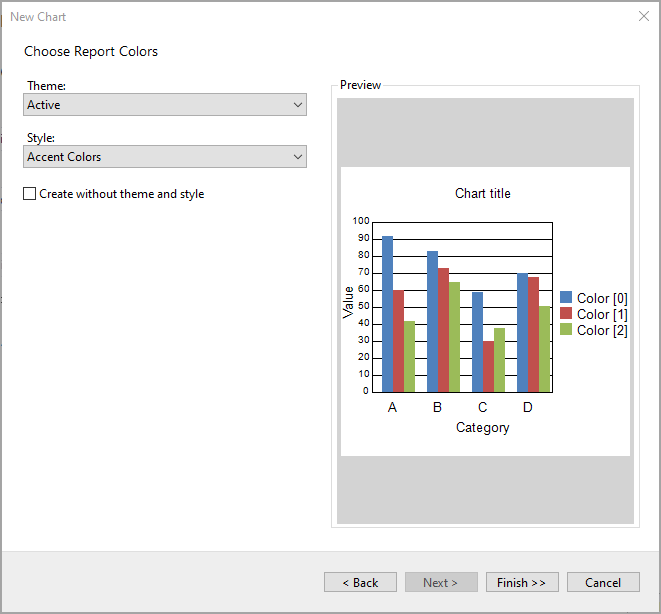
9. On the final screen of the Report Wizard, choose the report colors and preview the report.
10. Click **Finish** to successfully add the report with the CSV data source. 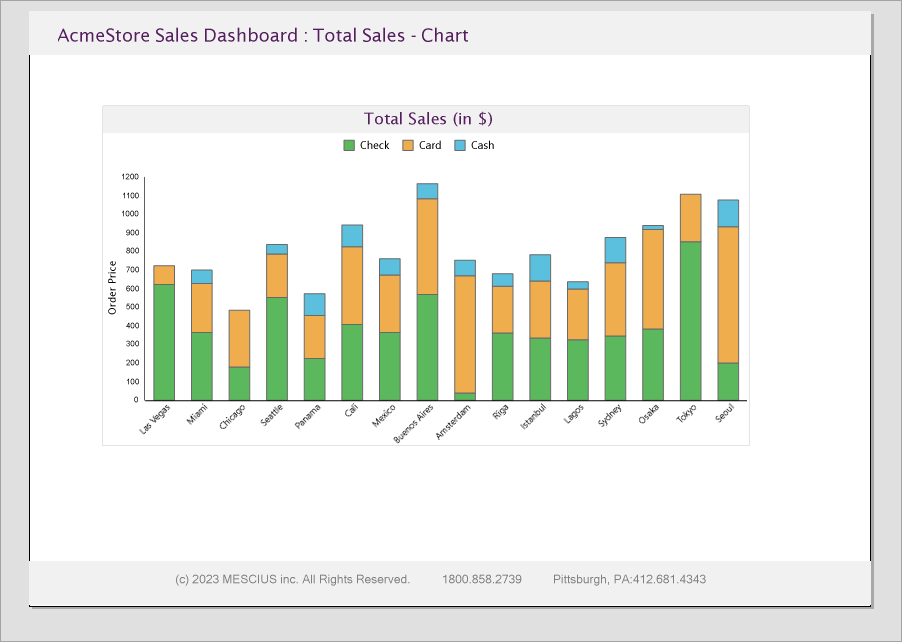
### Design Report Layout
**ReportSection2**
1. From the **New** tab that appears below the design area, add ReportSection2.
2. In this section of the report, drag-drop the **Table** data region.
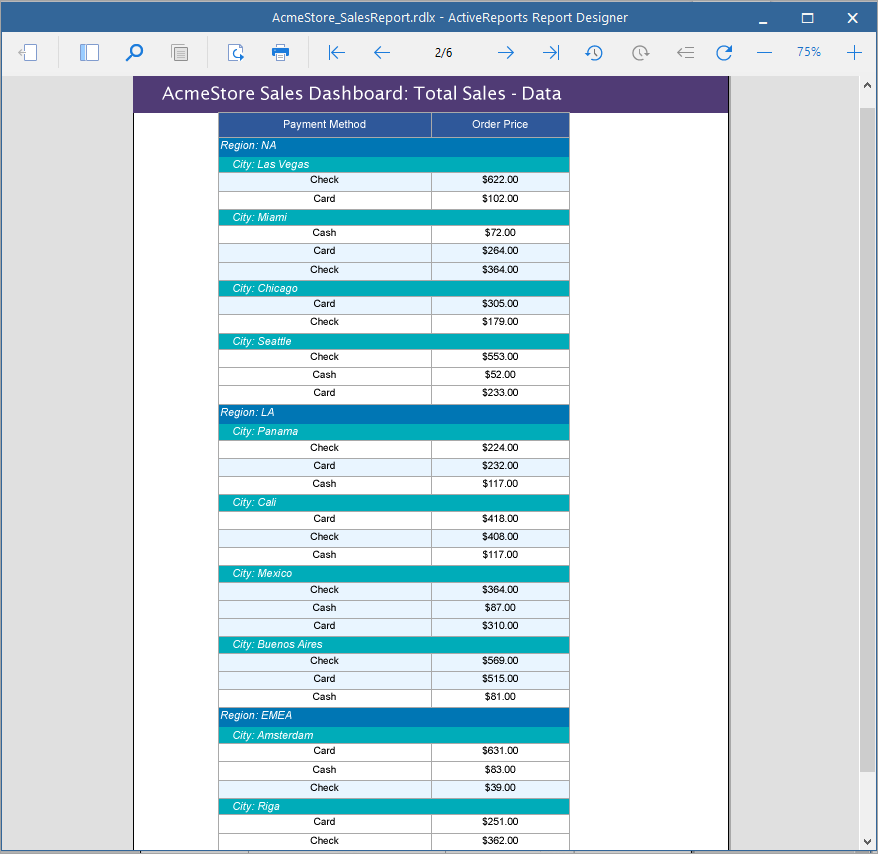
3. Delete the third column of the table since we want to display payment methods and the order prices as the sales data. This data will be grouped by payment method, city, and region.
4. Select the **Details** row, right-click, and select **Insert Group** from the context menu. We will be adding three groups - payment method, city, and region.
5. In the **Table - Groups** dialog, add the groups and set the **Name** and **Group on** > **Expression** in the following sequence as follows:
| **S.no.** | **Name** | **Expression** |
| --- | --- | --- |
| 1. | GroupByRegion | =[region\] |
| 2. | GroupByCity | =[city\] |
| 3. | GroupByPaymentMethod | =[payment\_method\] |
6. Click **OK** to close the dialog.
7. Delete the **Details** row of the table.
8. Populate the data in the Table data region as follows:
1. Merge the first table group and in the **Value** property of the merged cell, enter the expression ="Region: "Fields!region.Value
2. Merge the second table group and in the **Value** property of the merged cell, enter the expression ="City: "&Fields!city.Value
3. In the third table group, enter the following expression in the first and second cell, respectively:
1. =Fields!payment\_method.Value
2. =Sum(Fields!order\_price.Value)
9. Click the **ReportSection2** tab and from the Properties panel, set **PaperOrientation** to 'Portrait'.
**ReportSection3**
1. From the **New** tab that appears below the design area, add ReportSection3.
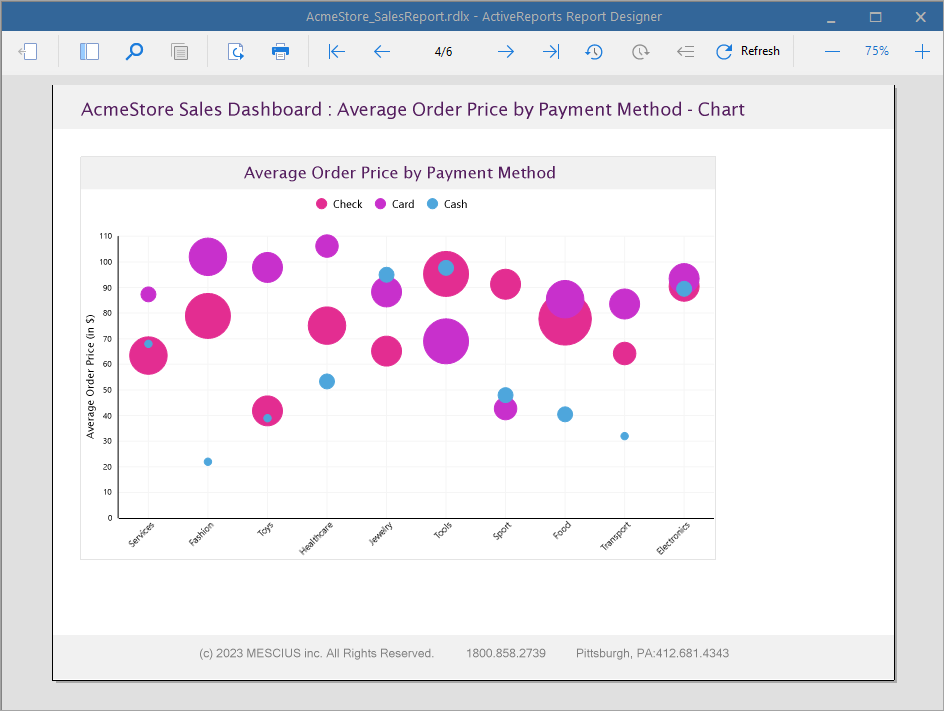
2. In this section, drag-drop a **Chart** data region to plot the average order price by payment method using a Bubble chart. See [Create Bubble Chart](/activereportsnet/docs/v19.2/report-authors/report-controls/report-controls-page-rdl-report/chart-page-rdl/plots/scatter-bubble-dvcharts/create-bubble-chart) tutorial to visualize the data in a bubble chart.
3. Click the **ReportSection3** tab and from the Properties panel, set **PaperOrientation** to 'Landscape'.
**ReportSection4**
1. From the **New** tab that appears below the design area, add ReportSection4.
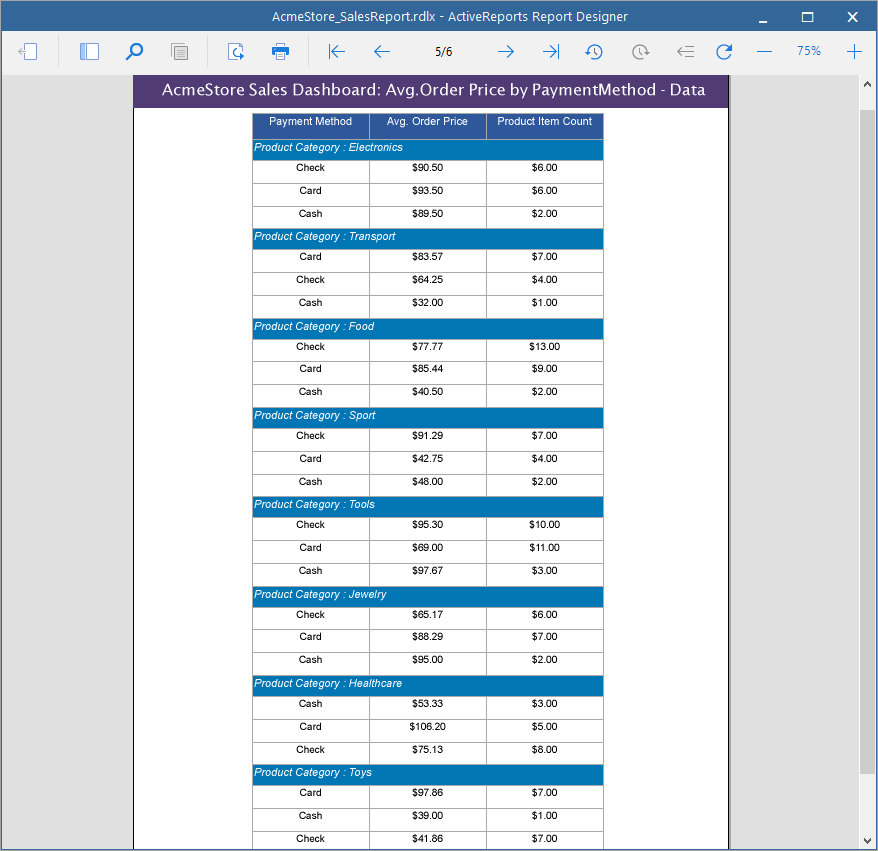
2. In this section, drag-drop a Table data region and drop the fields onto the table cells to display the average order price and payment method and the product item count.
3. Click the **ReportSection4** tab and from the Properties panel, set **PaperOrientation** to 'Portrait'.
### Preview Report
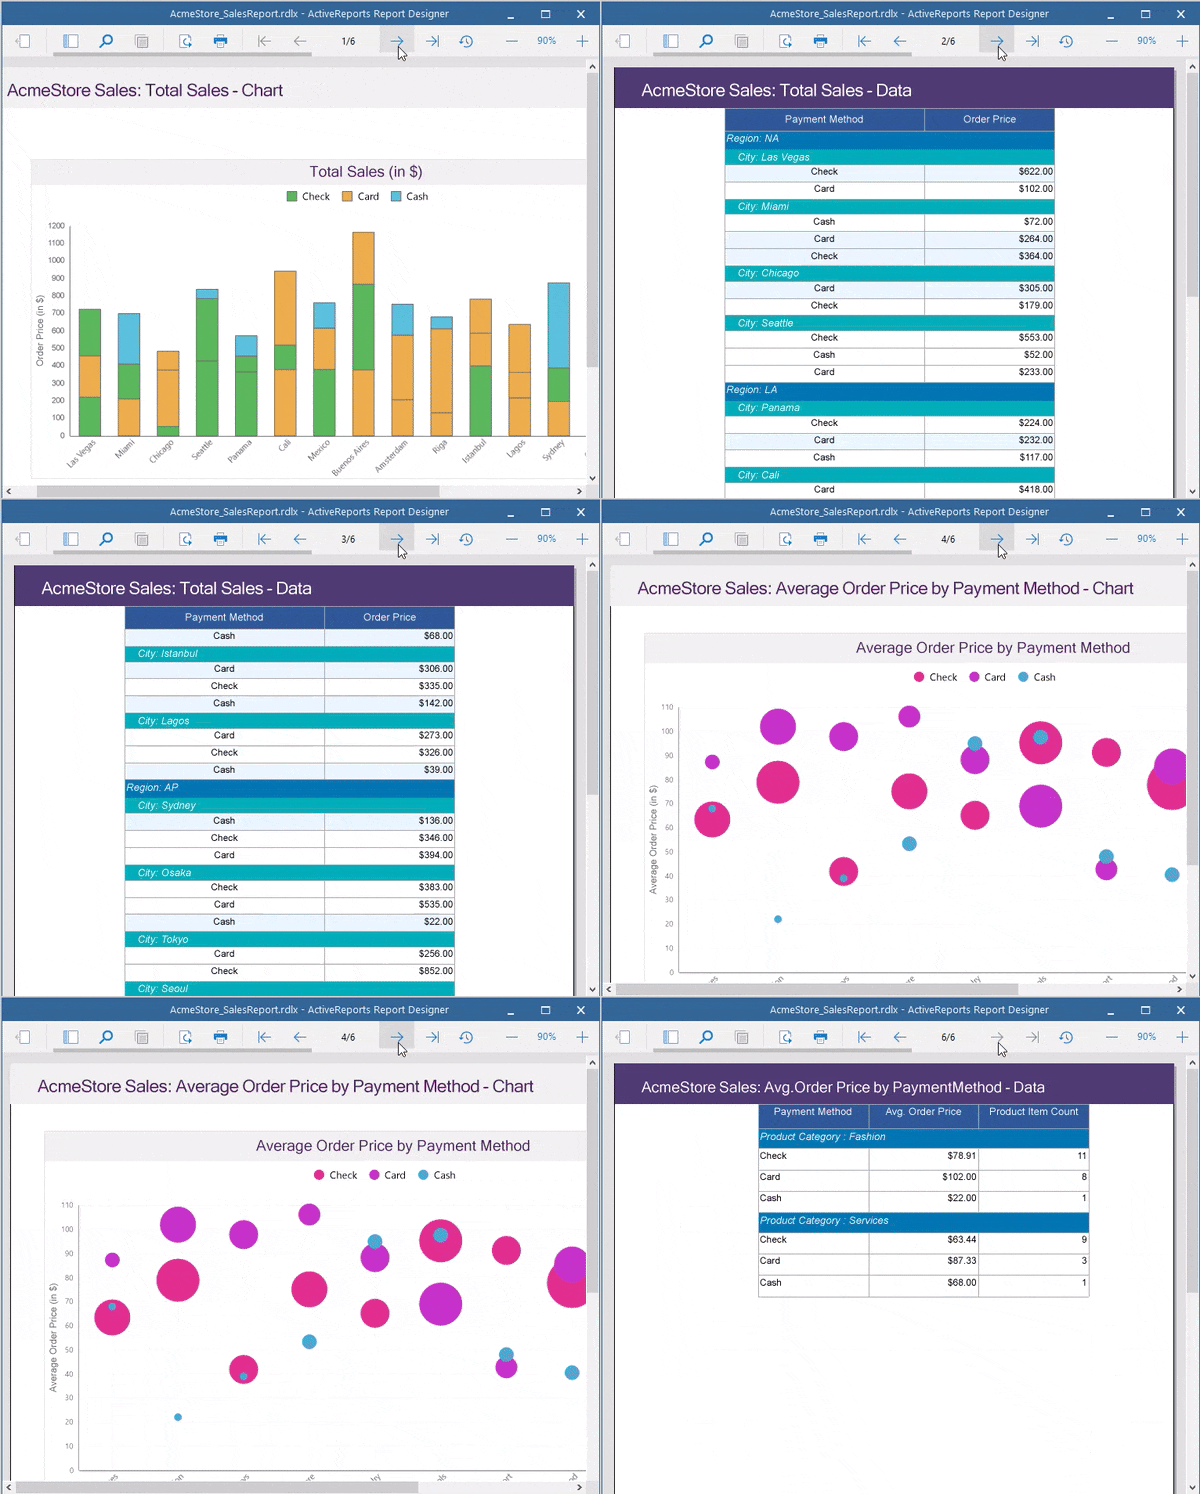
The final report is shown at the beginning of this page.
## See Also
[Standalone Designer](/activereportsnet/docs/v19.2/report-authors/standalone-designer-app)
#### Developers
[Visual Studio Integrated Designer](/activereportsnet/docs/v19.2/developers/working-with-reports-devs/activereports-designer)