# Animation

The JS Viewer (and WebViewer control) provides the API  to add animations to charts and tables. You can enable animation on charts when the chart is loaded and when the user hovers over a chart or a table.

## Content


The Js Viewer (and WebViewer control) provides the [API](/activereportsnet/docs/v19.2/developers/create-applications/js-viewer-application/jsviewer-api) for users to add animations to charts and tables. You can enable the animation feature on charts when the chart is loaded and when the user hovers over a chart or a table.


> type=note
> **Note**: For the chart animations, you need to add the **jsViewer.chart.min.js** and **jsVIewer.chart.min.css** files from the [NPM](https://www.npmjs.com/package/@mescius/activereportsnet-viewer) packages to your project and link them on your page.

## Load Animation on Charts
![Load Animation Effect in Charts](https://cdn.mescius.io/document-site-files/images/b298aea2-8cb8-4a0f-be88-4f54aa263ebd/images/dvchart/chart_load.gif)

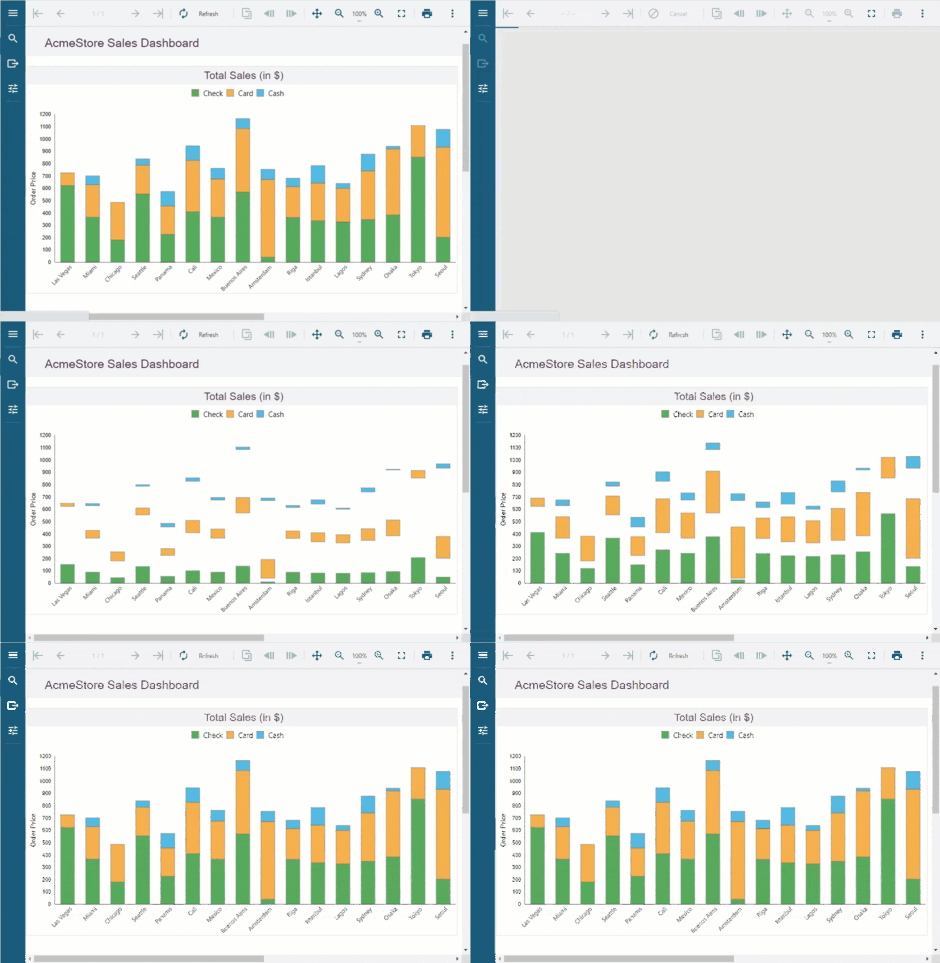
Load animation occurs when the chart first loads, or when the chart is forced to reload. To enable load animation in charts, use the following code:

```html
animation: {
    loadChart: {
        enabled: true
               }
           }
```

## Hover Animation

Hover animation occurs when the user hovers the mouse over a data point.

### Hover Animation on Charts

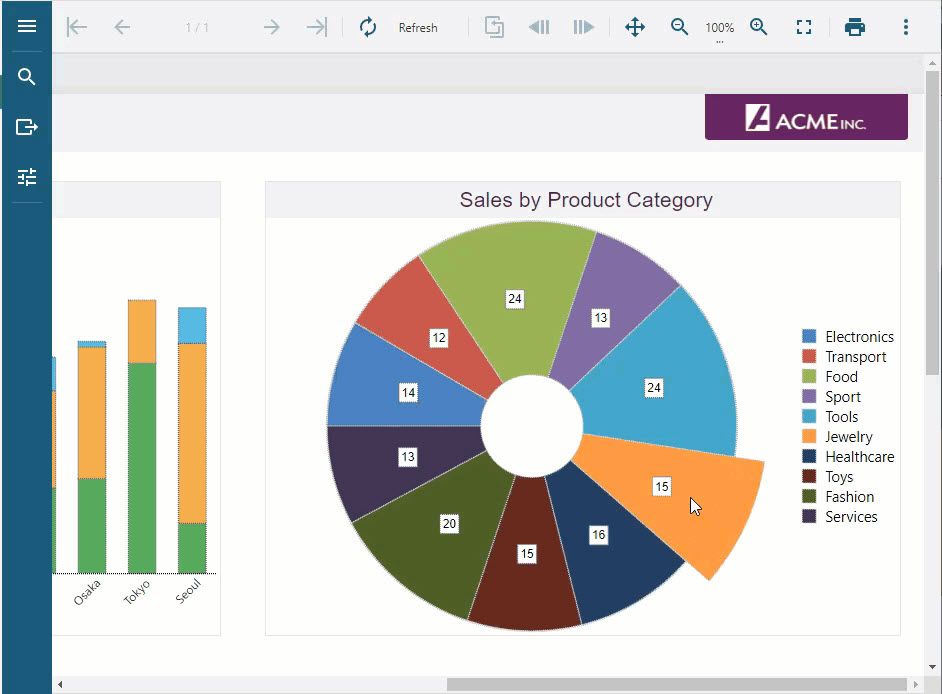
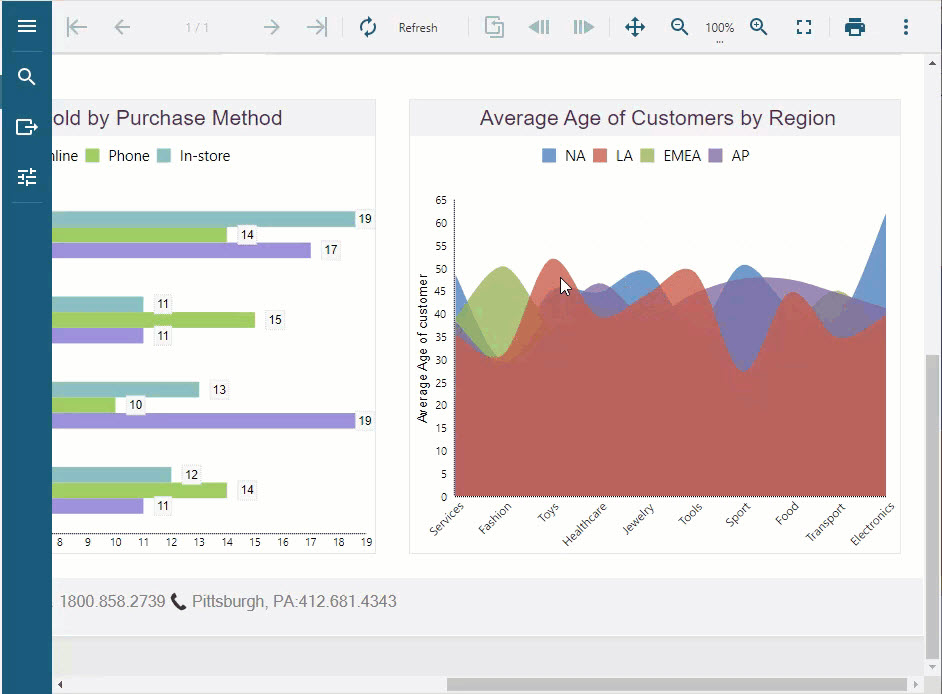
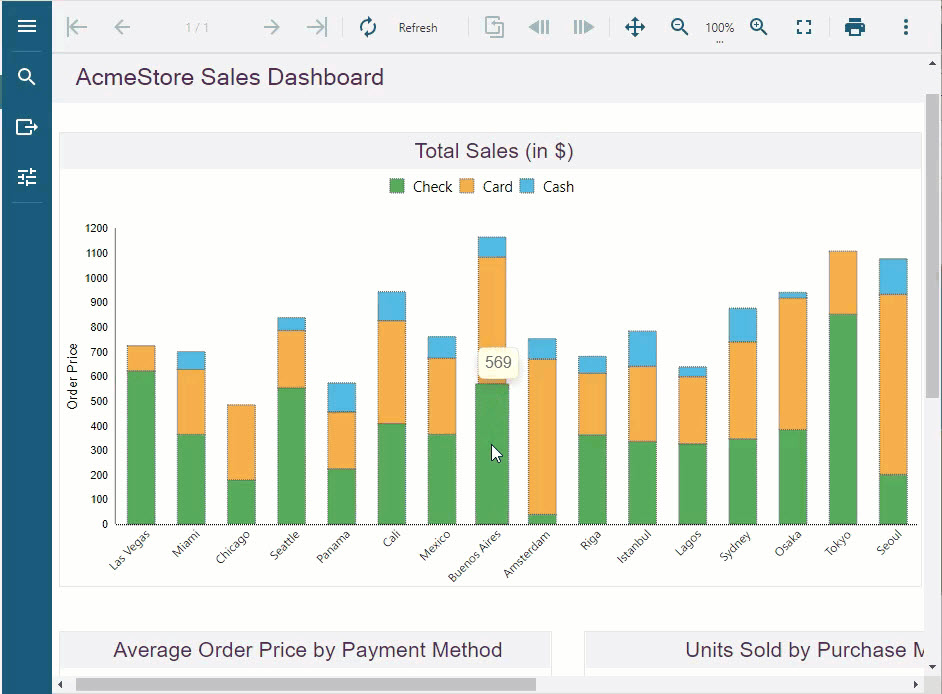
The hover animation in the case of charts scales the data point. The data point is enlarged when the user hovers the mouse over the data and is shrunk back to the original size when the user hovers away from the data point. Depending on the Tooltip template set on the chart while designing a chart, the hover labels can also be displayed over the data points.
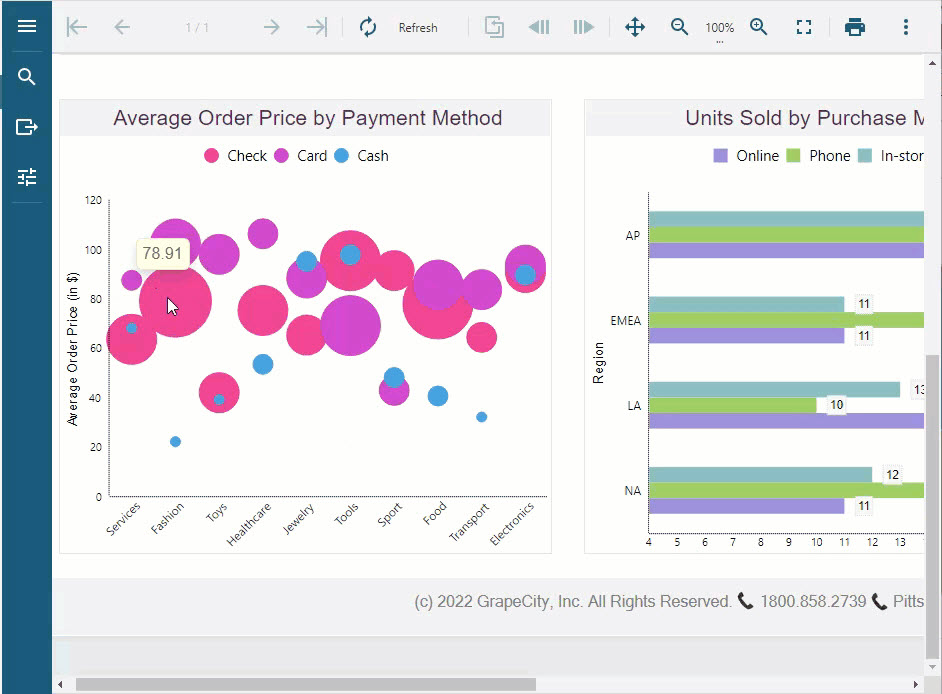
![Chart Hover Effect in Charts](https://cdn.mescius.io/document-site-files/images/b298aea2-8cb8-4a0f-be88-4f54aa263ebd/images/dvchart/chart-hover1.jpg)

![Chart Hover Effect in Charts](https://cdn.mescius.io/document-site-files/images/b298aea2-8cb8-4a0f-be88-4f54aa263ebd/images/dvchart/chart-hover2.jpg)

![Chart Hover Effect in Charts](https://cdn.mescius.io/document-site-files/images/b298aea2-8cb8-4a0f-be88-4f54aa263ebd/images/dvchart/chart-hover3.jpg)

![Chart Hover Effect in Charts](https://cdn.mescius.io/document-site-files/images/b298aea2-8cb8-4a0f-be88-4f54aa263ebd/images/dvchart/chart-hover4.jpg)

```html
animation: {
    hoverChart: {
        enabled: true
                },
           }
```

### Hover Animation on Tables

The hover animation in the case of tables highlights the table row by coloring the row background and the text on the hover.
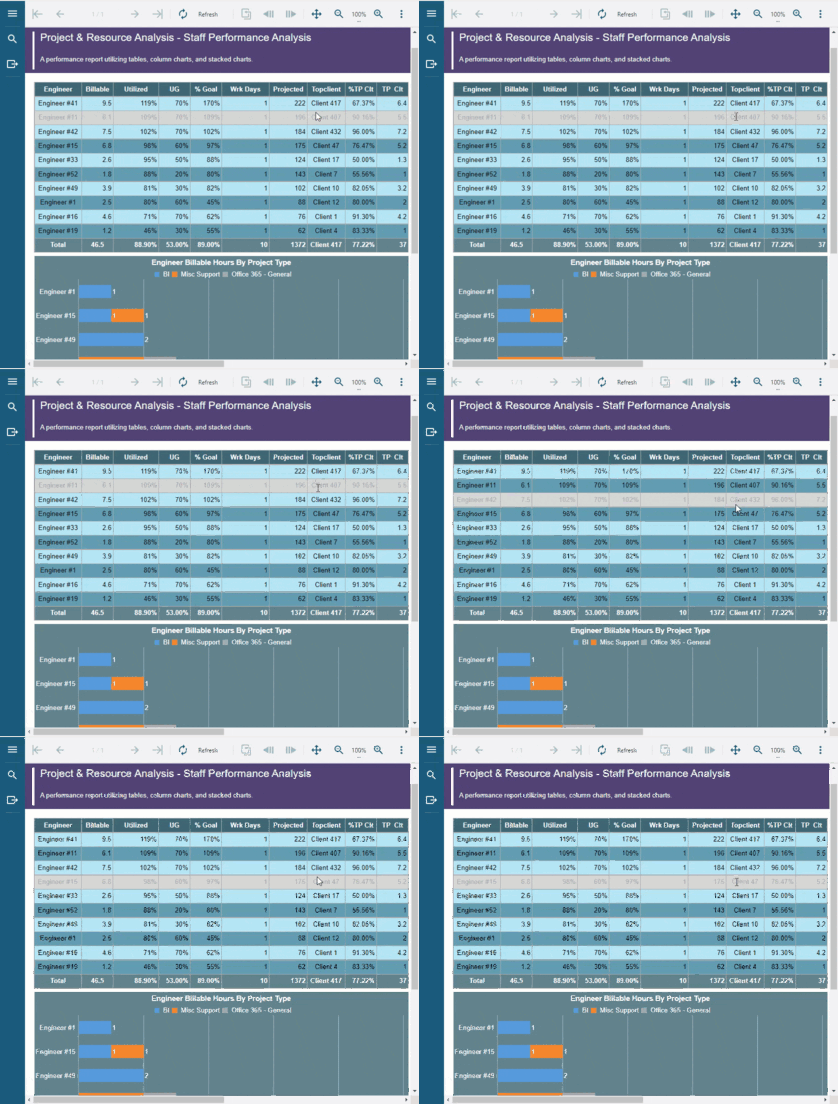
![Table Hover Effect in Charts](https://cdn.mescius.io/document-site-files/images/b298aea2-8cb8-4a0f-be88-4f54aa263ebd/images/dvchart/table-hover.gif)

```html
animation: {
    hoverTable: {
        enabled: true,
        backgroundColor: 'LightGray',
        textColor: 'DarkGray'
                }
            }
```

## Complete Code Implementation

The complete working code is provided below for implementing the chart load, and the chart and table hover animations.

```html
<!DOCTYPE html>
<html lang="en">
<head>
    <meta charset="utf-8">
    <link rel='shortcut icon' type='image/x-icon' href='favicon.ico' />
    <meta name="viewport" content="width=device-width, initial-scale=1, shrink-to-fit=no">
    <meta name="theme-color" content="#000000">
    <title>JS Viewer</title>
    <link href="jsViewer.min.css" rel="stylesheet">
    <link href="jsViewer.chart.min.css" rel="stylesheet" />
    <link href="index.css" rel="stylesheet">
</head>
<body onload="loadViewer()">
    <div style="width: 100%">
        <div id="viewerContainer"></div>
    </div>
    <script type="text/javascript" src="jsViewer.min.js"></script>
    <script type="text/javascript" src="jsViewer.chart.min.js"></script>
    <script type="text/javascript">
        let viewer;
        function loadViewer() {
            viewer = GrapeCity.ActiveReports.JSViewer.create({
                element: '#viewerContainer',
                displayMode: "Continuous",
                pageView: {
                    horizontalAlignment: "center",
                    viewMode: "standard" // default : noPaper
                },
                animation: {
                    hoverTable: {
                        enabled: true,
                        backgroundColor: 'LightGray',
                        textColor: 'DarkGray'
                    },
                    loadChart: {
                        enabled: true
                    },
                    hoverChart: {
                        enabled: true
                    }
                }
            });
           
            console.dir(viewer)
            viewer.openReport("DemoReport.rdlx");
        }
    </script>
</body>
</html>
```