# Pie and Doughnut Charts
Learn about the 2D and 3D charts that fall under the Pie/Doughnut Chart category in ActiveReports such as Doughnut chart, Funnel chart, Pyramid chart, Pie Chart, and Ring Chart.
## Content
A **Pie Chart** is a circular chart divided into sectors to illustrate proportion. A **Doughnut Chart** is functionally identical to a **Pie** **Charts.** It also has single-series and multi-series versions, with the only difference that it has a hole in the middle.
### 2D Pie and Doughnut Charts
**Doughnut Chart**
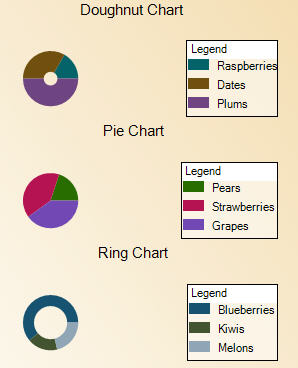
A doughnut chart shows how the percentage of each data item contributes to the total.
> type=warning
> In order to show each section of the pie in a different color, set the **Background** property for each data point.
**Funnel Chart**
A funnel chart shows how the percentage of each data item contributes as a whole
**Pyramid Chart**
A Pyramid chart shows how the percentage of each data item contributes as a whole.
### 3D Pie and Doughnut Charts
**Doughnut Chart**
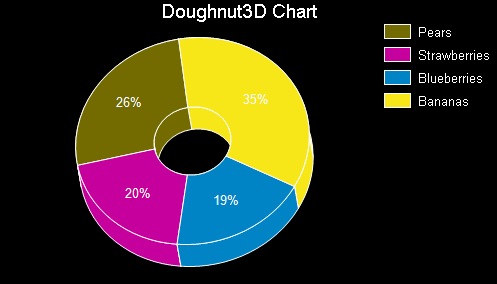
A 3D doughnut chart shows how the percentage of each data item contributes to a total percentage, allowing the data to be viewed in a 3D format.
**Funnel Chart**
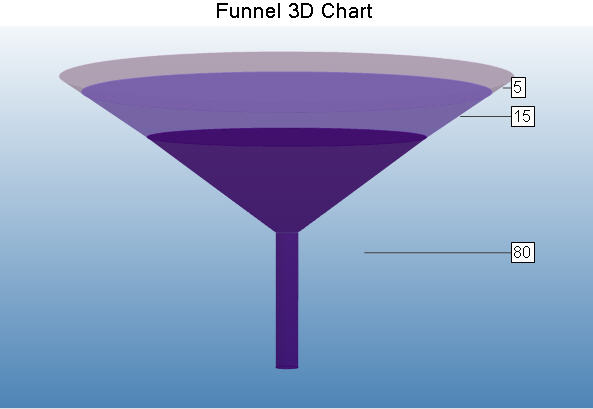
A 3D funnel chart shows how the percentage of each data item contributes to the whole, allowing the data to be viewed in a 3D format.
**Pyramid Chart**
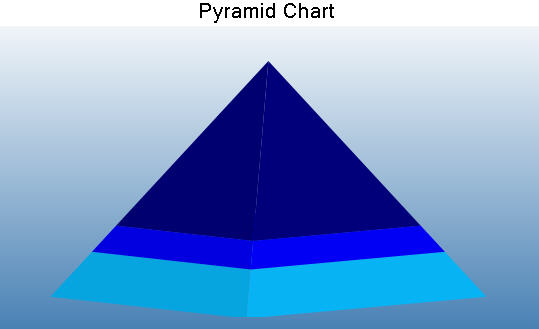
A 3D Pyramid chart shows how the percentage of each data item contributes to the whole, allowing the data to be viewed in a 3D format.
**Pie Chart**
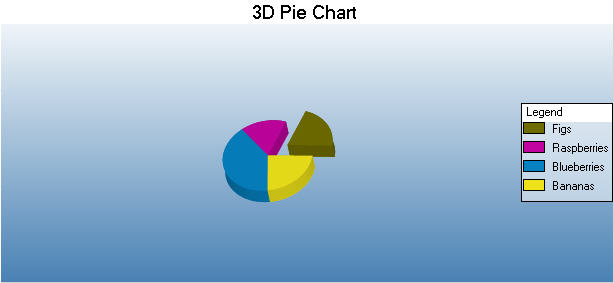
This type of chart displays the contribution of each value to a total.
**Ring Chart**
This chart type uses rings (inner and outer) to represent data.