# Tablix Data Region
Learn to design an RDLX report featuring the Tablix data region for visualizing shipments by country, quarter, and year, including summarized values.
## Content
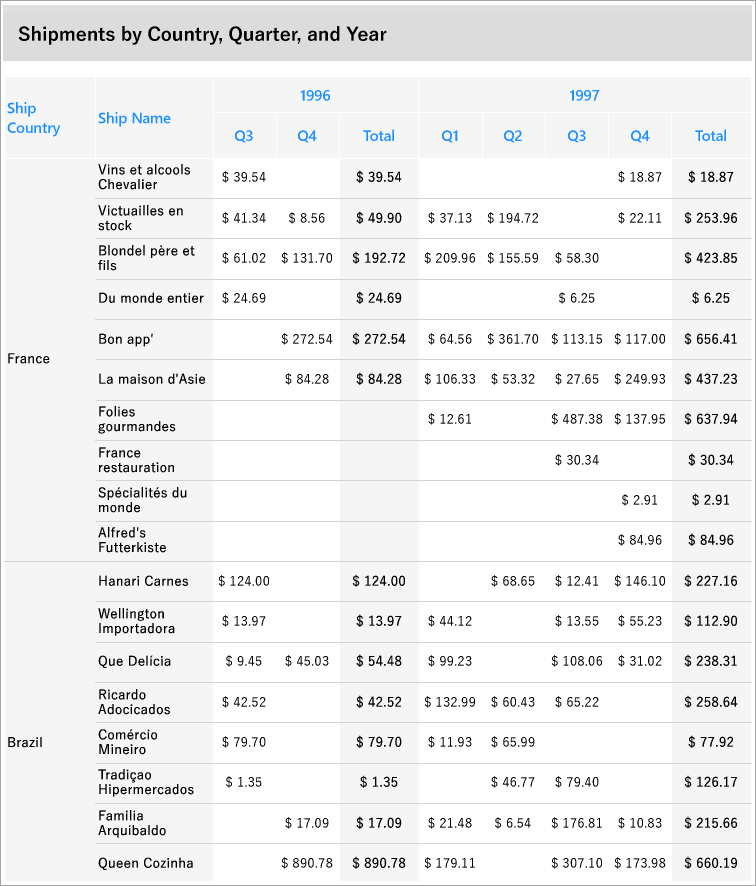
Let us create an RDLX report that uses the Tablix data region to display shipments by country, quarter, and year. To display a summarized value for each quarter and year, we will add additional adjacent rows/columns or parent or child row/column groups to the tablix. The report connects to the 'Orders' JSON data available [here](https://demodata.mescius.io/northwind/odata/v1/Orders).
The final report will look like as shown.
### Create a Report
In the ActiveReports Designer, create a new RDLX report.
> type=note
> If you are creating a new report in the Visual Studio Integrated Designer, see [Quick Start](/activereportsnet/docs/report-authors/standalone-designer-app/create-multi-section-rdl).
### Bind Report to Data
As you create a new report, you can configure the report data connection in the Report Wizard. You can also access the **Report Data Source** dialog by right-clicking the Data Sources node in the Report Explorer and then selecting the **Add Data Source** option. See [JSON](/activereportsnet/docs/report-authors/data-binding/data-binding-page-rdl-reports/connect-to-a-data-source/json) for details.
1. On the **Choose Data Source Type** screen of the wizard, select **JSON** and click **Next.**
2. To specify JSON **File Path**, click the **Browse** button and navigate to the desired file on your system. This report uses the 'DimEmployees.json' sample data source that can be downloaded from the following URL:
[https://demodata.mescius.io/northwind/odata/v1/Orders](https://demodata.mescius.io/northwind/odata/v1/Orders)
3. Click the **Next** option and configure the dataset by adding a valid query. Enter OrdersDataset into the **Name** field and select the node from the data tree in the **Path** section to generate the path. The resulting query is displayed in the **Query** field.
4. Click **Next** to proceed to the final screen of the Report Wizard.
5. Review the summary of the report and click **Finish** to successfully add the report with the JSON data source.
### Design Report Layout
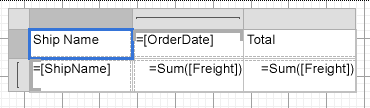
1. Drag and drop the **Tablix** data region on the report's design area.
2. From the dataset, drag and drop the [ShipName\] field onto the **Row Group** area.
3. Select the textbox on the upper-left corner of the tablix and set its **Value** property to 'Ship Name'.
4. Then, drag and drop the [OrderDate\] field onto the **Column Group** area.
5. Similarly, drag and drop the [Freight\] field onto the **Values** area, which is the body of the tablix. Note that the [Freight\] field changes to Sum(Freight).
6. In the Properties pane, set the **Format** property for the Freight field to Currency.
7. Right-click the **OrderDate** column group area and select the **Add Total** > **After** option from the context menu to display the total freight charges for the order years.
### Manage Data
In a Tablix data region, you need to manage how a grouped data is rendered across the rows and columns. This is done by using Group Expressions as explained below.
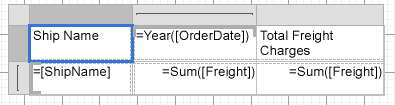
1. Modify the =Fields!OrderDate.Value expression to =Year(Fields!OrderDate.Value) to display only the Year part of the date in the textbox of the column group.
2. With the Tablix data region selected, go to the **Group Editor**  to display row groups and column groups.
3. Select Tablix1\_OrderDate1 column group and go to the Properties pane.
4. In the **Group Expressions** property, click **Show Items**.
5. Update the **Group Expression** to =Year(Fields!OrderDate.Value).
6. Update the textbox with **Total** label to 'Total Freight Charges'.
### Add Row and Column Groups
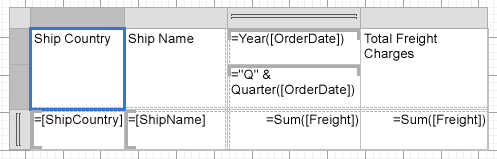
Let us add row and column groups to the tablix data region. We will add a child group to the **OrderDate** column group to display total prices for each quarter of a year. Similarly, we will add a parent group **ShipCountry** to **ShipName** row group to show countries and group the ship names according to the country.
1. Right-click the **OrderDate** column group area to view options in the context menu.
2. Go to **Column Group** and select the **Child** option.
3. From the **Group Editor**, select the newly added child group i.e. Tablix1\_ColumnGroup1 and go to the Properties pane.
4. In the **Group Expressions** property, click **Show Items** and click **Add**.
5. Set the **Group Expression** to =Quarter(Fields!OrderDate.Value).
6. Now, select the **OrderDate** child group area in the tablix and set its **Value** property to ="Q" & Quarter(Fields!OrderDate.Value).
7. Similarly, right-click the **ShipName** row group area to add a parent group from the context menu.
8. Go to **Row Group** and select **Parent** option.
9. From the **Group Editor**, select the newly added parent group i.e. Tablix1\_RowGroup1 and go to the Properties pane.
10. In the **Group Expressions** property, click **Show Items** and click **Add**.
11. Set the **Group Expression** to =Fields!ShipCountry.Value.
12. Now, select the **ShipCountry** row group area in the tablix and set its **Value** property to =Fields!ShipCountry.Value.
13. Provide a label **Ship Country** to the column displaying the ship country.
14. Merge the [Ship Country\], Ship Name, and Total Freight Charges textboxes with the empty adjacent cells.
### Add Totals to the Groups
We will add a total row to display the sum of freight charges for each country and a subtotal column to display the total freight charges for each quarter of the order year.
1. Right-click the **ShipCountry** column group area and select the **Add Total** > **After** option from the context menu.
2. Similarly, right-click the **OrderDate** child group area and select the **Add Total** > **After** option from the context menu.
### Add Report Title and Preview Report
1. To add the report title, drag and drop the TextBox control to the PageHeader section and set its **Value** property to 'Shipments by Country, Quarter, and Year'.
2. Improve the appearance of the report and preview.
## See Also
[Tablix](/activereportsnet/docs/report-authors/report-controls/report-controls-page-rdl-report/tablix)