# Sparkline Control
ActiveReports allows you to set properties for sparklines such as line style, color fill, visibility etc. This tutorial guides you through the process of using line and area, stacked bar and whisker and column sparklines in a report.
## Content
## Line and Area Sparklines
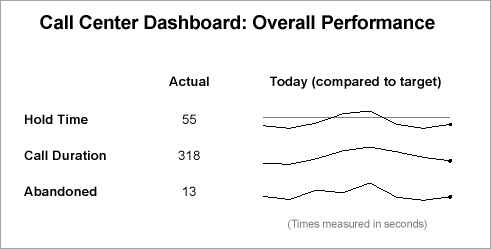
Let us create a report that displays the call center data trend compared to the target (times measured in seconds). Each sparkline control will display data for three criteria - call hold time, call duration, and abandoned calls.
> 
### Create a Report
In the ActiveReports Designer, create a new RDLX report.
> type=note
> If you are creating a new report in the Visual Studio Integrated Designer, see [Quick Start](/activereportsnet/docs/report-authors/standalone-designer-app/create-multi-section-rdl).
### Bind Report to Data
As you create a new report, you can configure the report data connection in the Report Wizard. You can also access the **Report Data Source** dialog by right-clicking the Data Sources node in the Report Explorer and then selecting the **Add Data Source** option. This report uses the 'CallCenter.xml' data source that you can download from [GitHub](https://github.com/activereports/Samples19/tree/main/Data/). See [XML](/activereportsnet/docs/report-authors/data-binding/data-binding-page-rdl-reports/connect-to-a-data-source/xml) for details on binding to XML data.
1. On the **Choose Data Source Type** screen of the wizard, select **XML** and click **Next.**
2. To specify XML **File Path**, click the **Browse** button and navigate to the desired file on your system. This report uses the 'CallCenter.xml' sample data source that can be downloaded from [GitHub](https://github.com/activereports/Samples19/tree/main/Data/).
3. Click the **Next** option and configure the following two datasets - **Targets** and **CallAverages**.
4. Enter Targets into the **Name** field and select the node from the data tree in the **Path** section to generate the path. The resulting query is displayed in the **Query** field.
5. Click Add to add the second dataset.
6. Enter CallAverages into the **Name** field and select the node from the data tree in the **Path** section to generate the path. The resulting query is displayed in the **Query** field.
7. Click **Finish** to successfully add the report with the JSON data source.
### Design Report Layout
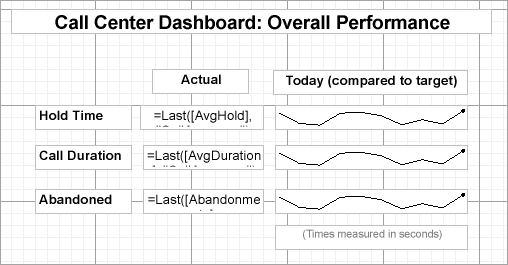
1. Drag and drop three **TextBox** controls and place them one below another. These controls will be the criterion labels. Set their **Value** property as follows:
* TextBox2: Hold Time
* TextBox3: Call Duration
* TextBox4: Abandoned
2. Drag and drop a **TextBox** control near Hold Time and set its **Value** to =Last(Fields!AvgHold.Value, "CallAverages").
3. Drag and drop a **TextBox** control near Call Duration and set its **Value** to =Last(Fields!AvgDuration.Value, "CallAverages").
4. Drag and drop a **TextBox** control near Abandoned and set its **Value** to =Last(Fields!Abandonments.Value, "CallAverages").
5. Drag and drop a **TextBox** control above the last three TextBoxes and set its **Value** to 'Actual'.
6. Drag and drop the **Sparkline** control against Hold Time and set its **Name** to HoldTimeSparkline.
7. Set the following properties of the **HoldTimeSparkline** to some suitable values, for example:
* SeriesValue: =Fields!AvgHold.Value / First(Fields!THoldTime.Value, "Targets")
* LowerBound: 1
* UpperBound: 1.005
* RangeVisibility: True
* DataSetName: CallAverages
8. Drag and drop the **Sparkline** control against Call Duration and set its **Name** to CallDurationSparkline.
9. Set the following properties of the **CallDurationSparkline** to some suitable values, for example:
* SeriesValue: =Fields!AvgDuration.Value / First(Fields!TDuration.Value, "Targets")
* LowerBound: 1
* UpperBound: 1.005
* RangeVisibility: True
* DataSetName: CallAverages
10. Drag and drop the **Sparkline** control against Abandoned and set its **Name** to AbandonementsSparkline.
11. Set the following properties of the **AbandonementsSparkline** to some suitable values, for example:
* SeriesValue: =Fields!Abandonments.Value
* LowerBound: 1
* UpperBound: 1.005
* RangeVisibility: True
* DataSetName: CallAverages
12. Drag and drop the **TextBox** control above the last three sparklines and set its **Value** to 'Today (compared to target)'.
13. Drag-drop a **TextBox** control below the Sparkline controls and set its **Value** to '(Times measured in seconds)'.
14. To create the report's title, drag and drop the **TextBox** control onto the report’s designer and set its **Value** to 'Call Center Dashboard: Overall Performance'.
15. Modify the appearance of the report and preview.
## Whisker and Column Sparklines
You can use a whisker sparkline to render “win/loss/tie” scenarios (for example, sports statistics) or “true/false” scenarios (for example, was the sales goal met or the temperature above average).
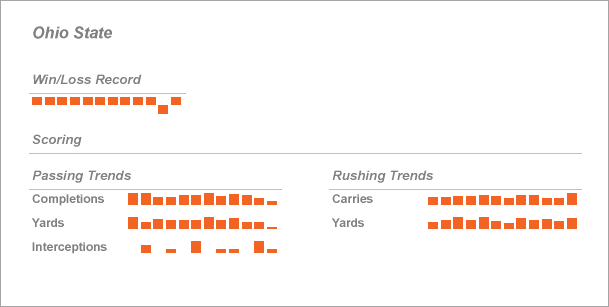
Let us create a report to show the statistics for the football game using Sparkline controls of type Whisker and Column.
### Create a Report
In the ActiveReports Designer, create a new RDLX report.
### Bind Report to Data
> **Connect to a Data Source**
1. As you create a new report, bind data to connect to the 'FootballStatistics.xml' data source on [GitHub](https://github.com/activereports/Samples19/tree/main/Data/). See [XML Provider](/activereportsnet/docs/report-authors/data-binding/data-binding-page-rdl-reports/connect-to-a-data-source/xml) page for details on binding with XML data. The connection string for our data is as shown:
```plaintext
xmldoc=C:\Data\FootballStatistics.xml
```
**Add Data Set**
2. Add the following dataset with the Query as shown:
```sql
//Game
```
### Design Report Layout
1. Drag and drop the List data region inside which we will drop all the controls.
1. Set the **DataSetName** to 'Games'.
2. Click open the **Property dialog**.
3. Go to **Detail Grouping** and set the **Group on** expression to =[Team\].
4. Click **OK** to close the dialog.
2. Drag and drop a TextBox control inside the List data region and set its Value to 'Win/Loss Record'
3. Drag and drop the **Sparkline** control inside the List data region, below the textbox added in the previous step, and, with the sparkline selected, set the properties as follows:
* Sparkline Type: Whiskers
* SeriesValue: Set this property to =Fields!WinLossTie.Value from the connected data set.
* FillStyle > FillColor: #f26324
* Click open the **Properties dialog**, go to the **Sorting** page, and set the expression to =Fields!Date.Value and **Direction** to 'Ascending'
4. Now drag and drop a few more text boxes inside the List data region to show passing and rushing trends and some sparklines to visualize the corresponding data as shown:
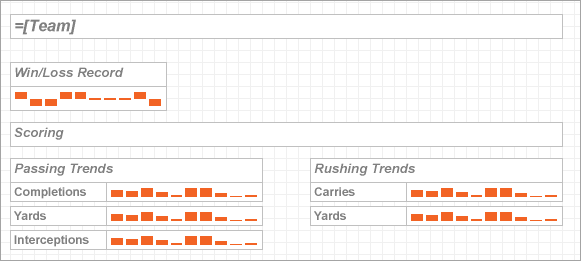
5. Fill in the text in the text boxes as shown above, and set the corresponding sparkline properties as follows:
Under 'Passing Trends',
* Select the sparkline next to 'Completions' text and set the **SeriesValue** to =Fields!PassCMP.Value
* Select the sparkline next to 'Yards' and set the **SeriesValue** to =Fields!PassYDS.Value
* Select the sparkline next to 'Interceptions' and set the **SeriesValue** to =Fields!PassINT.Value
Under 'Rushing Trends',
* Select the sparkline next to 'Carries' and set the **SeriesValue** to =Fields!RushATT.Value
* Select the sparkline next to 'Yards' and set the **SeriesValue** to =Fields!RushYDS.Value
6. To set the common properties of the sparklines added in the previous step, select the following properties:
* SparklineType: Columns7
* FillStyle > FillColor: #f26324
* Click open the **Properties dialog**, go to the **Sorting** page and set the expression to =Fields!Date.Value and **Direction** to 'Ascending'
7. To create the report's title, drag and drop the **TextBox** control inside the List data region on the top of the report and set its **Value** to =[Team\].
8. Modify the appearance of the report and preview.
## Stacked Bar Sparkline
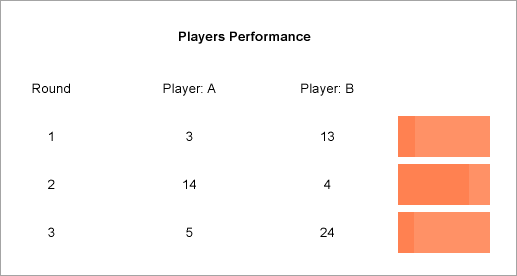
Let us create a report that shows the stacked bar sparkline use case. We will build our player performance data in the report to show the comparative scores of two players.
### Create a Report
In the ActiveReports Designer, create a new RDLX report.
### Bind Report to Data
> **Connect to a Data Source**
1. As you create a new report, bind data to the [players.csv](https://cdn.mescius.io/document-site-files/images/b298aea2-8cb8-4a0f-be88-4f54aa263ebd/file/players.csv) file. See [CSV Provider](/activereportsnet/docs/report-authors/data-binding/data-binding-in-section-reports/connect-to-a-datasource-section/csv-data-source-section) page for details on binding with CSV data. The connection string for our data is as shown:
```plaintext
Path=data\\MyOrders.csv;Locale=en-US;TextQualifier=";ColumnsSeparator=,;RowsSeparator=\r\n;HasHeaders=True
```
### Design Report Layout
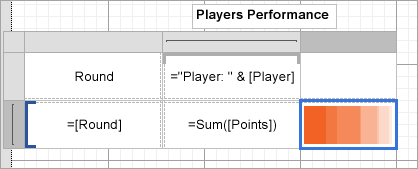
1. Drag and drop the Tablix data region onto the report's designer.
2. Drag and drop the [Round\] field onto the **Row Group** area.
3. In the **Values** area, write the expression =Sum([Points\]) to calculate the sum of points.
4. To add a new column, right-click anywhere on the second column of the Tablix and select **Insert Column** > **Outside Group**.
5. Drag and drop the **Sparkline** control in the third cell.
6. With the Sparkline selected, set the following properties:
* DataSetName: Players
* SeriesValue: =Fields!Points.Value
* SparklineType: StackedBar
* FillStyle > FillColor: Coral
7. Modify the appearance of the report and preview.
## See Also
[Tutorial: Sparkline Control](/activereportsnet/docs/report-authors/report-controls/report-controls-page-rdl-report/sparkline)