# Table Data Region for a Tabular Report
This is a tutorial on how to create an RDLX report that uses the Table data region to display the movie details including its name, released year, country, duration, and user ratings.
## Content
Let us create an RDLX report that uses the Table data region to display the movie details including its name, released year, country, duration, and user ratings. The report connects to the 'reels.db' data source available on [GitHub](https://github.com/activereports/Samples19/tree/main/Data/).
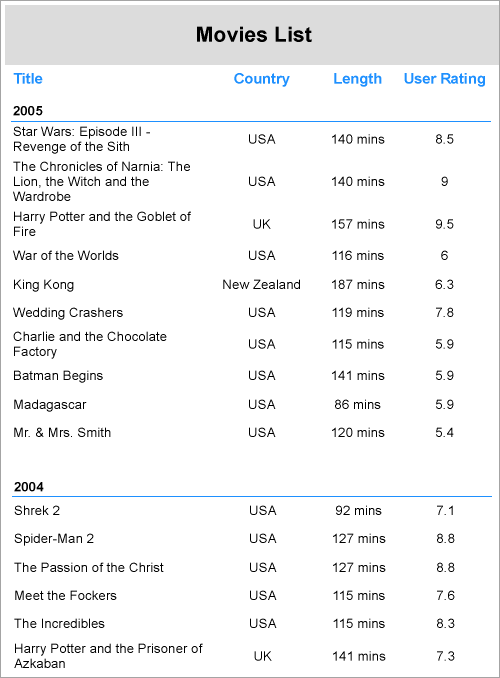
The final report will look as shown. The data in the table is grouped by the released year of movies.
### Create Report in Visual Studio Integrated Designer
In the ActiveReports Designer, create a new RDLX report.
> type=note
> If you are creating a new report in the Visual Studio Integrated Designer, see [Quick Start](/activereportsnet/docs/report-authors/standalone-designer-app/create-multi-section-rdl).
### Bind Report to Data
As you create a new report, you can configure the report data connection in the Report Wizard. You can also access the **Report Data Source** dialog by right-clicking the Data Sources node in the Report Explorer and then selecting the **Add Data Source** option. See [SQLite](/activereportsnet/docs/report-authors/data-binding/data-binding-page-rdl-reports/connect-to-a-data-source/sqlite) for details.
1. On the **Choose Data Source Type** screen of the wizard, select **SQLite** and click **Next.**
2. To specify the **DataBase Path**, click the **Browse** button and navigate to the desired file on your system. For example, you can connect to the Reels.db sample data source which can be downloaded from [GitHub](https://github.com/activereports/Samples19/tree/main/Data/).
3. Click **Test Connection** to test the connection.
4. Then click the **Next** option and configure the dataset by adding a valid query.
```sql
SELECT * FROM Movie
```
5. Into the Name field, enter the name of the dataset as **MoviesDataset**.
6. Click **Next** to proceed to the final screen of the Report Wizard.
7. On the final screen of the Report Wizard, review the summary of the report and click **Finish** to successfully add the report with the SQLite data source.
### Design Report Layout
1. Drag and drop the **Table** data region on the report’s designer.
2. From the dataset, drag the following data fields to the Details row of the Table data region: [Title\], [Country\], [Length\], and [User Rating\]. The **Header** row above the Details row is automatically filled with labels.
3. To display the movie length in minutes, select the [Length\] textbox and set its **Format** property to ### mins.
4. With the Table data region selected, click the **Property dialog** link to open the Table dialog.
5. Go to the **Groups** page and click Add.
> type=note
> **Note**: Alternatively, you can add a group by selecting **Insert Group** in the context menu of the Table data region, and adding a group in the **Table - Groups** dialog that opens.
6. Set the **Group on Expression** to =Fields!YearReleased.Value.
This will ensure that the data in the table is grouped based on the [YearReleased\] field.
7. Navigate to the **Sorting** page. Set the **Sorting Expression** to =Fields!YearReleased.Value and **Sorting Direction** to Descending.
8. In the **Layout** tab and check the **Keep together on one page if possible** option.
This property will try to fit the entire group on the same page; either on the current page or on the following page. If this is not possible due to a large number of records, the content will split across multiple pages.
9. Click the **OK** button to close the dialog. A Group Header and a Group Footer are added.
10. Merge the cells in the **Group Header** row and enter the expression in the **Value** property as =[YearReleased\].
This makes the group value appear and span above each group.
11. To add the report title, drag and drop the TextBox control to the PageHeader section and set its **Value** property to 'Movies List'.
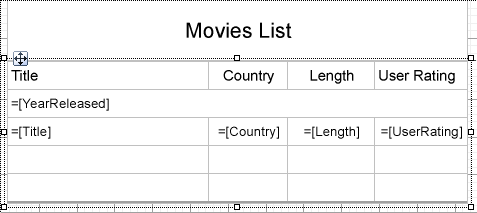
12. Improve the appearance of the report and preview.
## See Also
[Table](/activereportsnet/docs/report-authors/report-controls/report-controls-page-rdl-report/table)