# Bullet Control to Visualize Sales against Target
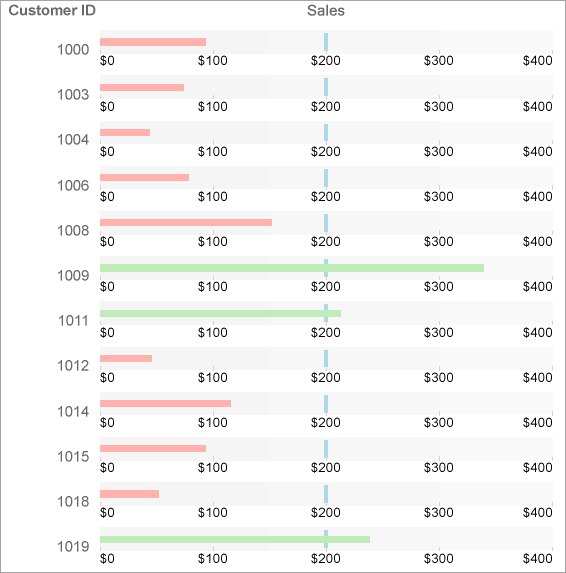
This is a tutorial on how to create a report that shows the sales relative to a target sale amount for each customer, using the Bullet control inside a Table data region.
## Content
Let us create a report that shows the sales relative to a target sale amount for each customer. We will use the Bullet control inside a Table data region to create this report. The report connects to the 'Sale' table from the 'Reels.db' data source available on [GitHub](https://github.com/activereports/Samples19/tree/main/Data/).
### Create a Report
In the ActiveReports Designer, create a new Page or an RDLX report.
> type=note
> If you are creating a new report in the Visual Studio Integrated Designer, see [Quick Start](/activereportsnet/docs/report-authors/standalone-designer-app/create-multi-section-rdl).
### Bind Report to Data
As you create a new report, you can configure the report data connection in the Report Wizard. You can also access the **Report Data Source** dialog by right-clicking the Data Sources node in the **Report Explorer** and then selecting the **Add Data Source** option. See [SQLite](/activereportsnet/docs/report-authors/data-binding/data-binding-page-rdl-reports/connect-to-a-data-source/sqlite) for details.
1. On the **Choose Data Source Type** screen of the wizard, select **SQLite** and click **Next.**
2. To specify the **DataBase Path**, click the **Browse** button and navigate to the desired file on your system. For example, you can connect to the Reels.db sample data source which can be downloaded from [GitHub](https://github.com/activereports/Samples19/tree/main/Data/).
3. Click **Test Connection** to test the connection.
4. Then click the **Next** option and configure the dataset by adding a valid query.
5. Enter an SQL query like the following into the **Query** text box:
```sql
SELECT * FROM Sale ORDER BY Customer ASC
```
See [Query Builder in Microsoft SQL Client and OLEDB Providers](/activereportsnet/docs/report-authors/data-binding/data-binding-page-rdl-reports/add-dataset/query-builder-in-sqlclient-oledb) for more information on building SQL queries.
6. Click **Finish** to successfully add the report with the SQLite data source.
### Design Report Layout
1. Drag and drop the **Table** data region onto the design area of the Report Designer.
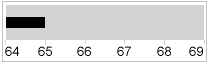
2. Drag a **Bullet** control onto the Details row of the table and in the Properties panel, set its **Value** property to
```
=Fields!SalesAmount.Value
```
This Value property is used to define the key measure displayed on the graph.
3. With the Bullet control selected on the design area:
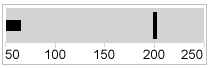
* Set its **Target Value** property to 200. This property defines a target for the Value to be compared to.
* Set its **Best Value** property to 400 and the **Worst Value** property to 0. The Best Value and Worst Value properties define the value range on the graph.
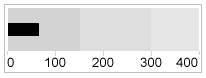
* You can also optionally encode the segments on the graph as qualitative ranges indicating bad, satisfactory, and good sections.
* The **Range1Boundary** property defines a value for the bad/satisfactory boundary on the graph. Set this property to 150.
* The **Range2Boundary** property defines a value for the satisfactory/good boundary on the graph. Set this property to 300.
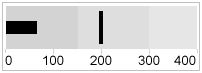
* You can also optionally define the **Interval** property for the graph value range. So, set this property to 100.
4. Specify the **TargetShape** as 'Line'.
5. Specify the position of **TickMarks** as 'Inside'.
6. Modify the appearance of the report. You can customize the appearance of bullets as follows:
1. Set the **TargetStyle** and the **TickStyle** properties.
2. Specify color patterns based on the relative value of the key measure. For example, set the expression like the following in the **ValueColor** property to show the color pattern based on the value of [SalesAmount\]:
`=iif(Fields!SalesAmount.Value >= 200, "#BFECB8", "#FFB1AE")`
## See Also
[Bullet](/activereportsnet/docs/report-authors/report-controls/report-controls-page-rdl-report/bullet)