# Show Row Number in Tablix and Table
Learn adding the row or column number for the specified group in Tablix or Table data regions.
## Content
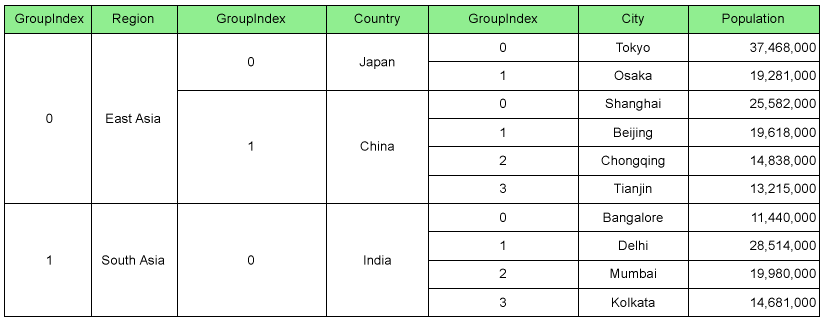
In the Tablix and Table data regions, you can have displayed a number of rows by using the **GroupIndex** function. The **GroupIndex** function returns the index of a row or column member in a data region's group.
These steps assume that you have already added a Page Report/RDLX report template to your project. The reports use the [Embedded JSON Data Source](/activereportsnet/docs/report-authors/data-binding/data-binding-page-rdl-reports/connect-to-a-data-source/json).
Follow these steps to use the GroupIndex function in Tablix and Table.
## Show the row number in a Tablix data region with three row groups
### Create a Report
In the ActiveReports Designer, create a new RDLX Report.
### Bind Report to Data
1. As you create a new report, the **Report Data Source** dialog appears for you to configure the report data connection. You can also access this dialog by right-clicking the Data Sources node in the Report Explorer and then selecting the **Add Data Source** option.
2. In the dialog, select the **General** page and enter the name of the data source, 'PopulationData' and connect your report to the JSON data source as described [here](/activereportsnet/docs/report-authors/data-binding/data-binding-page-rdl-reports/connect-to-a-data-source/json).
3. In the **Report Data Source** dialog, under Connection, select the **Embedded** option. Add the report data as follows and then click **OK**.
Add the JSON embedded data
```json
[{"Region":"East Asia","Country":"Japan","City":"Tokyo","Population":37468000},{"Region":"East Asia","Country":"Japan","City":"Osaka","Population":19281000},{"Region":"East Asia","Country":"China","City":"Shanghai","Population":25582000},{"Region":"East Asia","Country":"China","City":"Beijing","Population":19618000},{"Region":"East Asia","Country":"China","City":"Chongqing","Population":14838000},{"Region":"East Asia","Country":"China","City":"Tianjin","Population":13215000},{"Region":"South Asia","Country":"India","City":"Bangalore","Population":11440000},{"Region":"South Asia","Country":"India","City":"Delhi","Population":28514000},{"Region":"South Asia","Country":"India","City":"Mumbai","Population":19980000},{"Region":"South Asia","Country":"India","City":"Kolkata","Population":14681000}]
```
4. In the Report Explorer, right-click the data source and select the **Add Data Set** option.
5. In the **DataSet** dialog that appears, go to **Query.** Enter the query as follows into the Query textbox and click **OK**.
```json
$.[*]
```
### Design Report Layout

From the toolbox, drag a **Tablix** data region onto the report design surface and set the **DataSetName** property to the name of the dataset.
1. In the **Group Editor**, select the Tablix row group.
1. Go to **Group** property and set the **Name** property to **Region** in the Properties grid**.**
2. Go to **GroupExpressions** property and open the **Expression Collection Editor**.
3. Click **Add** and set the **Expression** to =Fields!Region.Value.
2. Right-click TextBox3, select **Expression...** and in the **Expression Editor**, enter =GroupIndex(Region).
3. In the Group Editor, go to Row Groups. Select **Region** and click **Add New Group**, then **Add Group > Child Group**.
1. With the new group selected, go to **Group** property and set the **Name** property to **Country** in the Properties grid**.**
2. Go to **GroupExpressions** property and open the **Expression Collection Editor**.
3. Click **Add** and set the **Expression** to =Fields!Country.Value.
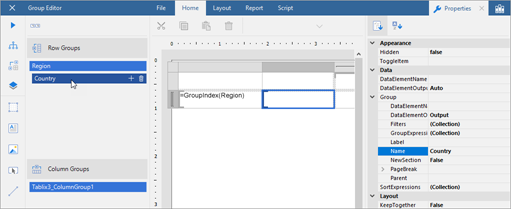
4. Right-click TextBox5 and select **Expression...**
5. In the Expression Editor, enter =GroupIndex(Country).
6. In the Group Editor, go to Row Groups. Select **Country** and click **Add New Group**, then **Add Group > Child Group**.
1. With the new group selected, go to **Group** property and set the **Name** property to **City** in the Properties grid**.**
2. Go to **GroupExpressions** property and open the **Expression Collection Editor**.
3. Click **Add** and set the **Expression** to =Fields!City.Value.
7. Right-click TextBox7 and select **Expression...**
8. In the Expression Editor, enter =GroupIndex(City).
9. Hover over the column handler next to the Region row group and click **Insert Column**.

10. Set the **Value** of TextBox9 to =Fields!Region.Value.
11. Hover over the column handler next to the Country row group and click **Insert Column**.
12. Set the **Value** of TextBox11 to =Fields!Country.Value.
13. Hover over the column handler next to the City row group and click **Insert Column**.
14. Set the **Value** of TextBox13 to =Fields!City.Value.
15. Set the values of the last column in the Tablix as follows.
| TextBox | Value |
| --- | --- |
| TextBox2 | Population |
| TextBox4 | =Sum(Fields!Population.Value) |
16. Fill-in the Table Header to display the columns they represent.
17. Select the Tablix and set the **BorderStyle** property to 'Solid' to view the merged cells clearly.
18. Select the Tablix header row and set the **TextAlign** property to 'Center'. Repeat this step for the detail row.
19. Select TextBox4 and set its **Format** property to 'n0'.
## Show the row number in a Table data region with two table groups
### Create a Report
In the ActiveReports Designer, create a new RDLX Report.
### Bind Report to Data
1. As you create a new report, the **Report Data Source** dialog appears for you to configure the report data connection. You can also access this dialog by right-clicking the Data Sources node in the Report Explorer and then selecting the **Add Data Source** option.
2. In the dialog, select the **General** page and enter the name of the data source, 'PopulationData' and connect your report to the JSON data source as described [here](/activereportsnet/docs/report-authors/data-binding/data-binding-page-rdl-reports/connect-to-a-data-source/json).
3. In the **Report Data Source** dialog, under Connection, select the **Embedded** option. Add the report data as follows and then click **OK**.
Add the JSON embedded data
```json
[{"Region":"East Asia","Country":"Japan","City":"Tokyo","Population":37468000},{"Region":"East Asia","Country":"Japan","City":"Osaka","Population":19281000},{"Region":"East Asia","Country":"China","City":"Shanghai","Population":25582000},{"Region":"East Asia","Country":"China","City":"Beijing","Population":19618000},{"Region":"East Asia","Country":"China","City":"Chongqing","Population":14838000},{"Region":"East Asia","Country":"China","City":"Tianjin","Population":13215000},{"Region":"South Asia","Country":"India","City":"Bangalore","Population":11440000},{"Region":"South Asia","Country":"India","City":"Delhi","Population":28514000},{"Region":"South Asia","Country":"India","City":"Mumbai","Population":19980000},{"Region":"South Asia","Country":"India","City":"Kolkata","Population":14681000}]
```
4. In the Report Explorer, right-click the data source and select the **Add Data Set** option.
5. In the **DataSet** dialog that appears, go to **Query.** Enter the query as follows into the Query textbox and click **OK**.
```json
$.[*]
```
### Design Report Layout
1. From the toolbox, drag a **Table** data region onto the report design surface.
2. Set the **DataSetName** property to the name of the dataset.
3. Select the **Details** row, right-click, and select **Insert Group** from the context menu.
4. In the **Table - Groups** dialog, add two groups and set the **Name** and **Group on** > **Expression** in the following sequence as follows:
| S.no. | Name | Expression |
| --- | --- | --- |
| 1. | Region | =Fields!Region.Value |
| 2. | Country | =Fields!Country.Value |
5. Click **OK** to close the dialog.
You will see the two groups, and respective group header and group footer rows added to the table.
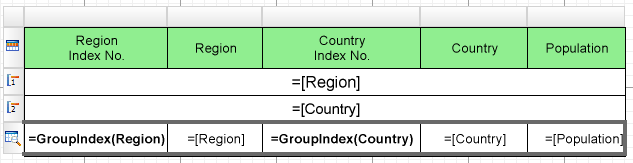
6. Merge the cells of the first group header row and enter =Fields!Region.Value.
7. Similarly, merge the cells of the second group header and enter =Fields!Country.Value.
8. Delete the footer rows.
9. Insert two more columns in the table. You can insert a column by selecting the last column of the table, right-clicking, and then selecting the **Insert Column to the Right**.
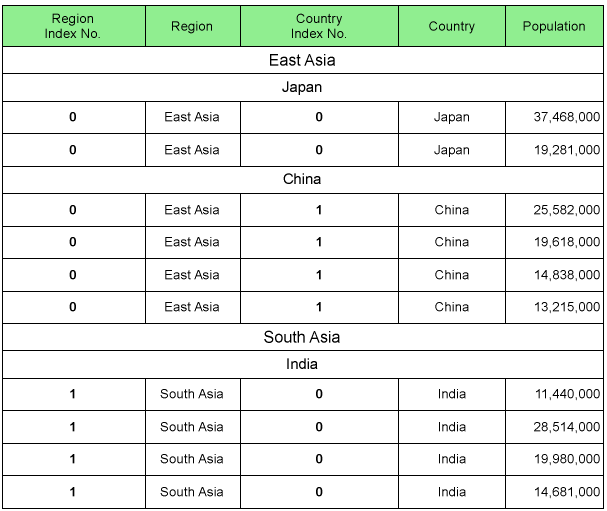
10. In the first textbox of the Details row, enter =GroupIndex(Region) to display the index number for Region table group and in the second textbox, enter =Fields!Region.Value to display the region name.
11. In the third textbox of the Details row, enter =GroupIndex(Country) to display the index number for Country table group and in the fourth textbox, enter =Fields!Country.Value to display the country name.
12. In the fifth textbox of the Details row, enter =Fields!Population.Value. and set its **Format** property to 'n0'.
13. Fill-in the Table Header to display the columns they represent.